Climate Model Berlin - Evaluation Maps 2005

Methodology

The delimited climatic-functional regions shall reveal statements in which areas

  • on the one hand a potential for the discharge of other (adjacent and also further) areas is present
  • on the other hand due to the spacious influence the strongest auxiliary loads can be expected,
  • preferred air interchange ranges can be assumed, i.e. an important role for near-surface fresh air transport is taken over.

The peculiarity of the different climate-ecological parameters were transferred into an appraising classification scheme for a better planning grading. These classifications take place after technical demands and orient themselves in regard to the class width at the value spectrum existing in the investigation area. As below, the qualitative gradation of the determined parameters, subdivided according to the topic tables units, is described. Finally, the grading of structural elements relevant to planning is depicted.

Green- and open space inventory

As cool air-producing ranges vegetation-coined open spaces are considered such as forests, parks and graveyards and, in addition, green-coined settlements with a small sealing degree (usually under 30 %). For a better handling the approx. 13,500 relevant single areas of the Urban and Environmental Information System (ISU) have been aggregated to approx. 700 functionally with one another connected green area units, whereas the subsumption took place with priority after the aspect of the spatial proximity. Thus several green areas form a matching unit with a minimum size of 0.5 hectares (cf. Fig. 1).

Fig. 1: Green area aggregation considering the example Airport Tempelhof and functionally connected areas. The dark green line marks the outline of the green area unit.

Fig. 1: Green area aggregation considering the example Airport Tempelhof and functionally connected areas. The dark green line marks the outline of the green area unit.

To characterize the compensation performance of green areas within the city as well as the cold air-generating areas of the surrounding countryside the cold air volume flow is adducted in the Climatic Functions Map. It expresses the inflow of cool air from the neighbouring grid cells in m3/s per 50 m grid cell, as it was determined in the context of the analysis phase of the model application (cf. Map 04.10 Climate Model Berlin, Edition 2009).

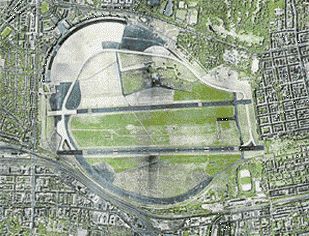
Figure 2 illustrates with the example of the Airport Tempelhof the near ground flow field, which is used to delimite the affect range of the cold air producing areas.

Fig. 2: Near ground current field and affect range of the cold air producing area of the Tempelhof Airport

Fig. 2: Near ground current field and affect range of the cold air producing area of the Tempelhof Airport

The classification of the volume flow occuring whithin green spaces complies with the procedure for the z-transformation as described in the VDI-guideline 3785 sheet 1 (VDI 2008). This statistical approach is related to the local/regional value level and evaluates the deviation of a climate parameter from the average conditions within an investigation area. As a result, this procedure defines four evaluation categories (most favourable / favourable / less favourable / unfavourable). These valuation classes are limited by the mean value as well as by the upper and lower S1-limit (standard deviation). This method provides the advantage of standardising the climate parameters, which results in a comparability among themselves or with other investigations.

The qualitative classification of the values is shown in table 1, whereas the volume flow should show a valuation of at least 0 to –1 to be regarded as climatological effective.

According to the classification mentioned below, a mean z-value has been assigned to every block segment of the digital basic map ISU5.

Cold air delivery of the cold air generating surfaces (volume flow)

Tab. 1: Cold air delivery of the cold air generating surfaces (volume flow)

The ranges of the discharge effects are characterised as “affecting ranges of the cold air generating surfaces” in the Climate Functions Map and are explained under the column of residential areas.

The inner-city cold air producing areas are illustrated by a colour, the cold air quantities of the surrounding countryside is marked by an arrow signature. The capability of cold air delivery is expressed by the arrow size, whereas the direction of the arrow reflects the main stream direction within a cold air catchment area. The spheres of influence, starting from the cold air producing areas of the surrounding countryside, are marked by outlines. They were defined by the cold air flow field at the 6:00 a.m. point of time so that they reflect the minted catchment area at the end of the night. Contrary to the green areas on the urban area of Berlin the cold air producing areas of the surrounding countryside do not receive planning advices.

The planning classification of a cold air producing green area in the Planning Advices Urban Climate Map is primarily determined by its location in the city and its proximity to burdened settlement areas. The sensitivity of an intensification of use comes along with the climatic relevance for the assigned residential areas (cp. table 2).

For areas with an urban climate importance of “very high” a maximum of sensitivity against housing, parcelling and sealing is given; they have to be supported in their function lastingly, i.e. particularly by avoidance of pollutant emissions within these surfaces.

To illustrate the air-hygienic load potential for green spaces, areas within green spaces with a NO2 concentration of more than 80 µg/m3 at weather conditions with a low air exchange have been defined, (cf. map description map 04.11.2 green and open space inventory).

Planning classification of cold air producing areas

Tab. 2: Planning classification of cold air producing areas

Open spaces with a very small cold air production within burdened areas possess only a minor urban climate importance. This concerns usually areas which do not have a connection to existing ventilation lanes due to their isolated position within the settlements. Furthermore these green spaces have not a compensation flow because of their small size. Nevertheless these areas can fulfil a function as a climate-ecological comfort island.

Settlement areas

The residential areas can be subdivided into sufficient aerated areas respectively climatically favourable settlement structures on the one hand and burdened areas on the other hand. The affect range of the cold air producing areas marks the maximum outflow of cold air from open areas into the surrounding settlement during a low-exchange, cloudless summer night between 10:00 p.m. and 06:00 a.m. A cold air current should obtain a flow velocity of at least 0.2 m/s to be classified as climate-ecologically meaningful. From this it follows that the housing within a cold air effect range exhibits a predominantly small to no bioclimatic burden. Sporadically the burden level rises so much that it cannot be lowered by an arising cool air flow.

Basis for the determination of the bioclimatic load of a block is the evaluation index PMV (Predicted Mean Vote) as a dimensionless factor for the nocturnal thermal stress. According to the classification of cold air generation of green spaces (cf. explanation tab. 1), a z-transformation of the PMV-grid has been conducted. For that purpose the PMV at the time 04.00 AM has been derived, which shows the best suitability for the determination of the bioclimatic load in the settlement area. Due to the heterogeneity of the model area, this point in time represents a compromise between the intra-urban situation on the one hand and the peripheral boroughs at the outskirts on the other hand.

The load classification complies with the four categories according to VDI-guideline 3785 sheet 1 (most favourable / favourable / less favourable / unfavourable). The respective value of the z-transformation within a block segment is the decisive factor for the attribution of a load classification (cf. tab. 3).

Bioclimatic load of settlement areas

Tab. 3: Bioclimatic load of settlement areas

The rating class 4 “unfavourable” shows a higher-than-average thermal load with a z-value of more than 1. A certain bioclimatic load is also given by the load category 3 “less favourable”. However, favourable conditions are given with the categories 2 and 1, which can be considered as positive from a bioclimatic point of view.

The latter category is primarily characterised by an open settlement structure and a high vegetation share and thus shows the soonest potential for a structural consolidation amongst the other functional areas. At present knowledge a careful compression of these areas will entail no re-classification into a climatically more unfavourable classification. At which magnitudes the individual limits for a structural compression are located can not be indicated overall; anyway options should be checked on the spot to compensate negative climatic effects by measures such as roof or facade greenery or limitation of large building volume.

The sensitivity of a possible intensification of use in settlement areas is associated with the bioclimatic burden. It can be considered as “very high” within the burden categories 3 and 4 and “high” within the remaining classes. This concerns mainly areas of high sealing (> 60 %) and covering degree (mostly > 50 %).

“Use intensification” means an increase in the built-up as opposed to the undeveloped proportion of an area. “This includes the transformation of the natural ground surface into a three-dimensional modelled space consisting predominantly of artificial materials, the resulting reduction of vegetation-covered surface area, and the effect of technical measures that cause waste heat and pollutant emissions” (Kuttler 1993).

Due to the limited amount of open space, measures for the relief of urban areas, including their build-up and densely-developed areas, are necessary. Of considerable importance in this regard is the greening of city spaces, streets, buildings and courtyards. In this way, overheating can be decreased, moisture level of the air can be increased and dust can be bound.

The heating of roofs depends very greatly on their colour and their material (cf. Map 04.06). Most favourable are greened roofs, with the type of plants playing a major role. However, the positive effects of such roofs, at their high locations, on the greatly burdened street area must be considered as limited. The greening of facades might have a greater overall climatic impact. Extensive investigations into the significance of facades and roof greening for the micro-climate were carried out in Berlin by Bartfelder und Köhler (1987).

The landscaping and/or the planting of vegetation for courtyard areas is also part of the climatic and clean-air improvement of residential areas. Narrow closed courtyards are characterized by a decrease in daytime temperatures and a slight cooling in the evening and nighttime hours. Insolation is greatly limited, as is air exchange, which creates a high pollution risk. The climatic condition improves with the greening of these courts, although facade-greening is more favourable for the promotion of air exchange than the planting of trees. Large courtyards clearly achieve more favourable climatic characteristics than narrow courts and street areas, especially if the degree of sealing is low and the vegetation is loosely structured. The cooling rate in the evening and nighttime hours is high. The air exchange is very good. A connection with adjacent smaller courtyards via vacant lots promotes this ventilation.

Within the street space the potential traffic-related air pollution along major roads marks road sections, in which the limit value of the 22. BImSchV is exceeded possibly and/or with a large probability.

Air exchange

Ventilation lanes connect cold air generation areas (compensation space) and burdened areas (stress areas) and are thus an elementary component of the air exchange. In consideration of the process types, four different air exchange types were worked out in the maps:

  • Ventilation lane, predominantly thermally induced,
  • Ventilation lane, predominantly orographically induced (e.g. small flood plain tracts),
  • Cold air outflow on slope areas (at a slope > 1°),
  • Spacious air-flow and ventilation channel (valleys of larger watercourses).

The determination of air-stream channels is geared to the autochthonous cold air flow field of the FITNAH-simulation. The determined ventilation lanes are, with exception of river valleys, vegetation-coined surfaces with a linear adjustment on affected spaces. The classification of planning is oriented, similarly to the cold air generating green and open spaces, to the burden situation within the assigned residential areas.

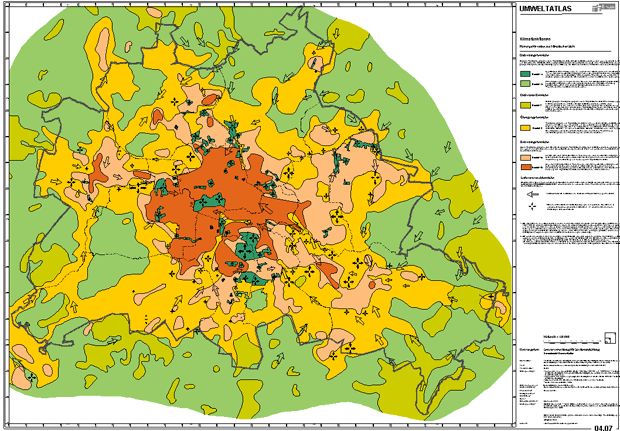
The methodology carried out here, notably to derive the Climate Functions Map, differs in its model-based approach elementary from the previous proceeding, also conducted in Berlin. The hitherto Climate Functions Map (cp. Fig. 3)

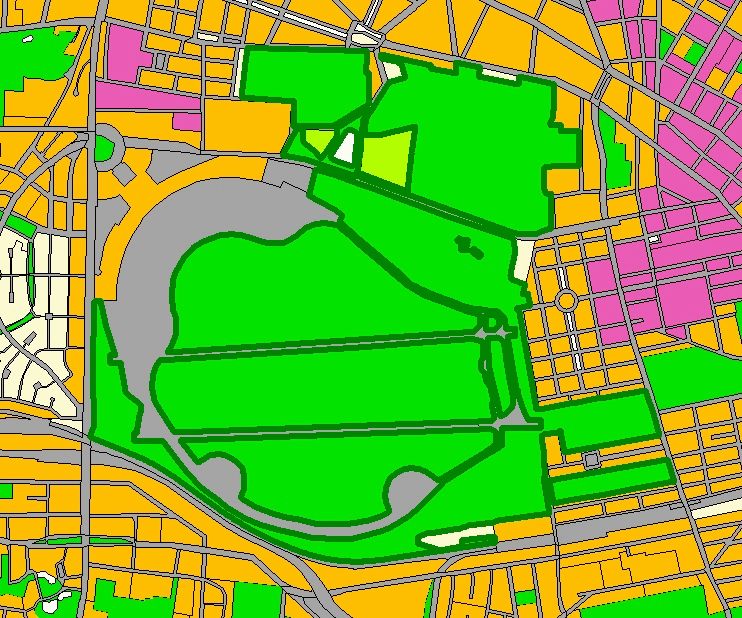
Fig. 3: Previous Climate Functions Map (04.07) of the Berlin Digital Environmental Atlas (Edition 2001)

Fig. 3: Previous Climate Functions Map (04.07) of the Berlin Digital Environmental Atlas (Edition 2001)

is based on a large amount of measured parameters, but the ascertainment of plain information and consideration of functional connections as well as interaction between the areas additionally requires the knowledge of the described flow fields.

However, this area-wide information with an area size of 1,780 km² as covered by the FITNAH model, can only be obtained by numeric models. From this it follows that the previous classification of the burden level in urban areas as well as the compensation effects of green spaces exhibited a relative and not quantitative character. Furthermore in the past favoured spaces for near-surface fresh air transport have been pictured and proposed for further examination only based on their structure characteristics respectively. Criteria for their suitability were above all a small surface roughness, sufficient width (if possible more than 10 times the height of the surrounding bordering structures) as well as a predominantly weak immission load. Only for few ranges there was a meteorological measurement. Although this procedure offers a descriptive typing of the relevant areas, the process system is, however, due to this rather static and structure-orientated approach, not considered or only considered indirectly. (VDI 1997).

Traffic-related air pollution

The illustration of the potential traffic-related air pollution along main roads and within green spaces completes the spectrum of occuring loads and their possible effects on the health and well-being of people.

With regard to the road situation, it is a model-based calculation for the reference year 2005 considering up-to-date traffic countings, showing for single street sections the boundary values of the 22. BImSchV for NO2 as an annual mean, which should be adhered to by 01.01.2010, and which will likely and most likely respektively be exceeded.

In order to display how far and where the air pollution within green spaces differs significantly from the air-hygienic conditions in the larger surrounding area (background situation), the NO2-dispersion has been simlulated under the ancillary conditions of a summer day.

In addition, the road section-related background value of the NO2-load, that is the concentration above roof niveau calculated with the program system IMMIS, has been used. By combining the NO2 emission values on the one hand and the model calculations on the other hand, a good 50 m x 50 m grid of the concentration in the vicinity of main roads could be determined. As an additional basic condition, building data of the Automated property map with information on individual building heights has been used.