Soil-Scientific Characteristic Values 2015

Methodology

01.06.1 Soil Textures

Description

The type of a particular soil, or soil texture is determined by the grain size composition of its mineral components. Coarse soil (grain diameter > 2 mm) and fine soil (grain diameter < 2 mm) types are distinguished. In addition, in very wet locations, peat is formed by the accumulation of incompletely decomposed plant material, which may overlay mineral soils.

Fine Soil Textures
Fine soil textures are formed from certain proportions of the grain fractions clay, silt and sand. The main soil types are subdivided into clay, silt, loam and sand, with loam representing a grain mixture of approximately equal parts sand, silt and clay. Soil texture is an important characteristic value for the derivation of such ecological properties as nutrient and pollutant storage capacity, water balance and storage capacity, as well as filtration and buffering capacity regarding pollutants.

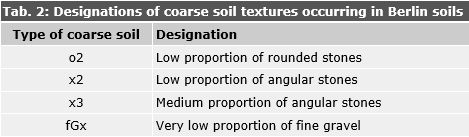
Coarse Soil Textures
All mineral components of the soil of > 2 mm in diameter can be described as coarse soil textures, or the soil skeleton. The proportion of coarse soil has an effect on water permeability, the air and nutrient balance, and the capacity to bind nutrients and pollutants. The higher the share of coarse soil, the more permeable a soil is, due to the large pores, while the capacity to bind and the nutrient level depend on the type of fine soil.
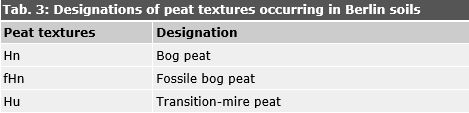
Peat Textures
Peat is formed in a water-saturated environment from the accumulation of incompletely decomposed plant material. It is characterized by a high water storage capacity and a very high cation exchange capacity (KAK). Various peat textures can be distinguished, according to the type of plant remains and their formation conditions. Lower bog peat is rich in alkalines and nutrients, and in some cases, even in carbonates. Transitionitional bog peats include plant remains from both low and high-nutrient locations.

Methodology

The fine, coarse and peat soil textures, each divided into topsoil (depth: 0 – 10 cm) and subsoil (depth: 90 – 100 cm), were determined for each soil association. The data were essentially taken from the profile sections by Grenzius (1987). Some values have been supplemented by expert evaluations.

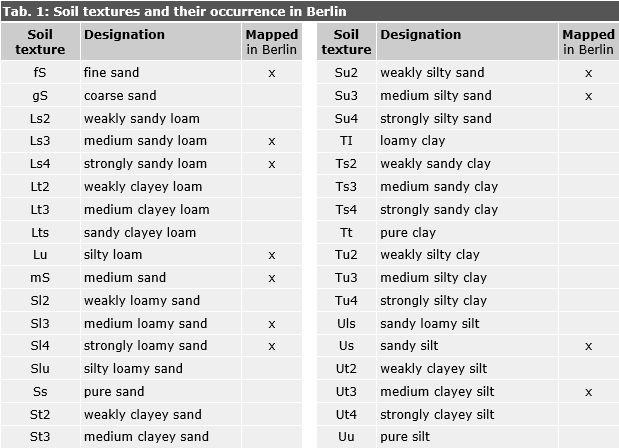
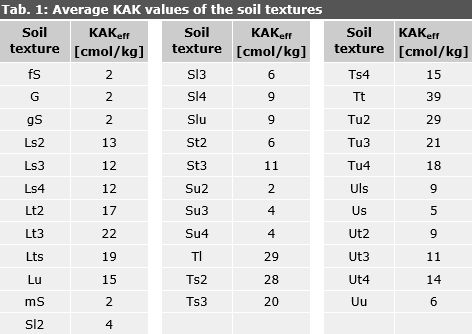
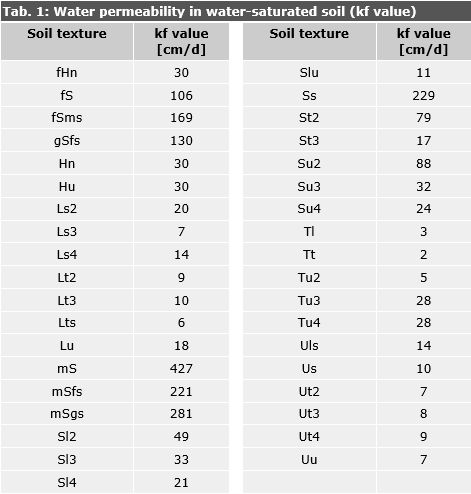
The mapped fine soil textures are summarized in Tab. 1. Soil textures differ across the topsoil and the subsoil at times, due to the material of which the soil was originally formed, soil development and its use. They were hence examined separately. In addition, soil textures which occur frequently within a soil association are identified as the main soil texture, and distinguished from the more rarely occurring soil textures, known as subsidiary soil textures.

Tab. 1: Soil textures and their occurrence in Berlin, based on the Bodenkundliche Kartieranleitung

Tab. 1: Soil textures and their occurrence in Berlin, based on the Bodenkundliche Kartieranleitung

Soil associations with largely the same fine soil textures in the topsoil and the subsoil were combined to a soil texture group. Soil texture groups were devised for the sole reason of creating an intelligible map with a straight-forward legend. For details or further calculations, more differentiated data are available. Some soil associations display the same soil textures in the topsoil and the subsoil. However, the majority of soil associations differ in the soil texture of their topsoil and subsoil.

Combining the soil textures of the topsoil with those of the subsoil resulted in 14 soil texture groups of fine soil (< 2 mm), which are represented in the map legend.

The soil associations of a soil texture group may differ within their group with regard to peat or stone content (soil skeleton, coarse soil > 2 mm) of their topsoil and subsoil, however. These have hence been labelled separately.

Tab. 2 displays coarse soil textures that characterize Berlin soils. It is distinguished between their occurrence in the topsoil and the subsoil.

Tab. 2: Designations of Coarse Soil Types Occurring in Berlin Soils

Tab. 2: Designations of Coarse Soil Types Occurring in Berlin Soils

Tab. 3 presents the peat textures occurring in Berlin. To represent their ecological properties and ascertain their characteristic values, a distinction is made between peat occurring in the topsoil and the subsoil. If several peat textures occur in a soil or a soil association, only the characteristic type of peat is taken into account (characteristic peat type).

Tab. 3: Designations of peat textures occurring in Berlin soils, according to the Bodenkundliche Kartieranleitung

Tab. 3: Designations of peat textures occurring in Berlin soils, according to the Bodenkundliche Kartieranleitung

01.06.2 Usable Field Capacity of Shallow-Root Plants

Description

The Usable Field Capacity (nFK) is the quantity of water in l/m2 or mm, which soil can retain, and which is usable for plants. This water fraction is held in the pores of soil against the force of gravity, and is available for plants. The nFK depends on soil texture, humus content, bulk density, and stone content. Fine soil can store significantly more water over longer periods of time than coarse soil. For the latter, precipitation water seeps away more quickly, and can no longer be used by plants. High humus contents and peat shares increase water storage.

Methodology

The nFK values of soil asssociations and soil textures were taken from the model profiles pictured in the profile section drawings by Grenzius (1987). There are two types of zones: the shallow-root zone (0 – 3 dm), and the deep-root zone (0 – 15 dm). The minimum and maximum nFK values for the shallow-root zone are defined by the soil texture of the soil association with the highest or lowest nFK values. In addition, the typical nFK value for the respective root zones is determined. This map presents only the typical nFK values for shallow-root zones.

As part of additional research on soil associations in East Berlin, Aey (1993) inferred conclusions based on the geology. In 2005, some lower nFK-values were differentiated further, while others were corrected with reference to data from Grenzius (1987).

The results were grouped into six levels (Tab.1) based on Grenzius (1987), since the Bodenkundliche Kartieranleitung (Soil-scientific mapping guidelines, 1994) does not specify any gradation.

Tab. 1: Usable field capacity for the shallow and deep-root zones (in mm) and their evaluation

Tab. 1: Usable field capacity for the shallow and deep-root zones (in mm) and their evaluation

01.06.4 Usable Field Capacity of the Effective Root Zone

Description

Assessing the water balance based on the field capacity in the effective root zone (nFKWe) yields a differentiated analysis of the availability of water to plants for a specific location. The different rooting depths and root zones are taken into account, in accordance with soil texture and use. Thus, forests and groves have a considerably greater root zone than, e.g. garden uses. In sandy soils, the effective root zone is lower than in loamy soils. In loamy soils, precipitation water is retained longer than in sandy soils. It is therefore advantageous for plant roots, in terms of the water and nutrient balance, to develop a larger root zone in loamy soils rather than in sandy substrates. In boggy soils, the effective root zone only extends as far as the zones affected by groundwater; only the top 20 – 30 cm usually serve as a root zone. The reason for the shallow-root zone is the lack of air in the permanently water-saturated horizons. Therefore, with the exception of some specialist plants, roots are confined to the upper horizons, which contain both sufficient air and water.

The additional water supply to the plants from the capillary rise of the groundwater during the vegetation period has a great impact on the nFKWe at lower depths to groundwater. It was, however, not taken into account in the present investigation.

Methodology

The Soil Science Department of the Technical University of Berlin ascertained the nFKWe for soil associations in dependence on actual land use in the context of an expert report (Plath-Dreetz/ Wessolek/ Renger 1989).

Initially, the effective root zones for Berlin locations were extracted from Tab. 1 according to their use. Based on the depth of the effective root zones, the field capacities for each horizon of the sample profiles documented by Grenzius (1987) were added, yielding the nFKWe. Appropriate correction factors for organic substances were taken into account. Since different soil textures appear within a single soil association, a range is derived for each soil association, represented by the minimum and maximum nFKWe values. In addition, a typical nFKWe value for the respective soil association, which is shown on the map, is determined depending on use.

Tab. 1: Depths of the Effective Root Zone (in dm), by Soil Type and Use

Tab. 1: Depths of the Effective Root Zone (in dm), by Soil Type and Use

The results were grouped into five levels (Tab. 2):

Tab. 2: Field capacity of the Effective Root Zone

Tab. 2: Field capacity of the Effective Root Zone

01.06.5 Humus Quantity

Description

Humus describes the entirety of the organic substance of dead plants and animals in the soil and consists of mulch and humic materials. The high sorption capacity of humic materials, the high share of nutrients available to plants, and favourable qualities for the water balance have a great influence on many soil functions. The humus content of mineral soils is determined by soil formation and use. Such uses as horticulture with introduction of compost, or intensive pasturing favour humus enrichment, while other uses show a considerably lower organic-substance content (cf. Tab. 1).

Wet vegetation locations, e.g. lea soils and bogs, have a high biomass production but a slow decay rate of humus. The enriched organic substance is present in the form of peats of varying degrees of decomposition. Half-bogs and lower bogs consist of 15 – 80 % of organic substance, depending on their use and the degree of decomposition of the peat. The prerequisite for a high organic substance content is permanent wetness in the topsoil which impedes or inhibits mineralization and near-natural utilization, such as extensive pasturing.

The humus quantity represents the quantity of dead organic substance present within a defined area of soil, depending on soil type and land use.The amount of humus is primarily an indicator of the nitrogen stock and the share of easily mobilizable nitrogen. But other important nutrients such as potassium, calcium, magnesium and phosphorus are also released and made available to plants by means of decomposition and humification of organic substances. In addition to the supply and storage of nutrients, humus also facilitates a higher water and pollutant storage capacity. The humus quantity is based on the humus content and the thickness of the humus horizons. It further depends on soil type and use. For example, damp boggy locations with high biomass production and low decomposition are thus characterized by a high humus quantity; and sandy dry soils with low vegetation coverage have a low humus quantity.

Methodology

The expected average humus content of mineral soils based on their use depending on their soil type and use was derived from investigations by Grenzius (1987) and soil analyses performed under the Heavy-Metal Investigation Programme (1986, 1987). These data were initially assessed by Fahrenhorst et al. (1990) who also ascertained the average humus content for the characteristic soil type of each soil association according to different uses. The database was expanded by Aey in 1993 using various individual mappings. Tab. 1 presentes a rough orientation, focusing on use only.

Tab. 1: Average Humus Contents by Use

Tab. 1: Average Humus Contents by Use

The humus contents of peats formed at wet locations are not taken into account for mineral soils. Their contents and thicknesses are listed separately in the investigation of humus quantity.

The humus quantity was calculated based on the humus content of the humus layer, also taking into account the peat quantity [mass %] and the effective bulk density and thickness of the organic horizons.The humus quantities determined for the each location were categorized into six levels, according to Tab. 2.
Tab. 2: Humus content levels, according to typical amounts of Berlin soils

Tab. 2: Humus content levels, according to typical amounts of Berlin soils

01.06.6 Organic Carbon Stock

Description

Dead organic matter (humus) in the soil consists of approximately 50 % organic carbon and is of elementary importance to the hydrological and nutritional balance of soils. As a result of the concentration, storage and mineralization of organic matter, and therefore organic carbon, soils play a major role in the global carbon cycle.

Soils constitute the largest form of terrestrial carbon storage and, besides oceans, the largest form of carbon storage of the world (IPCC 2000). A major influence on the carbon dynamic in soils is land use. Soils in urban environments are subjected to very high land use pressure, and suffer significant anthropogenic impact. On the one hand, this results in higher organic carbon stock than in natural systems, for instance due to horticultural activities. On the other hand, the destruction of natural soil functions leads to higher levels of mineralization of humus and therefore an increased release of carbon dioxide (CO2) into the atmosphere. This is of particular climatic importance, especially long-term, as the accumulation of humus and therefore the climate-effective binding of carbon in soils takes place over long periods of time.

Soils as carbon sinks play a special role in the global carbon cycle. Carbon sinks are also present in urban environments. Hydromorphic soils such as peat are notable in this context. Peat soils can potentially store up to ten times more carbon than other ecosystems (Batjes 1996). Due to changes in the water balance following melioration measures, most peat soils emit CO2 and CH4 (methane). For this reason, the protection and conservation of peat soils is of particular importance to local, regional and global climate protection. With a total area of just 7 %, covering almost 50 % of the organic carbon storage in the lower bog soils of Berlin, it is evident that peat soils have an important role to play as carbon sinks. Allotment gardens and other sites with long-term pedogenesis including graveyards, old forest sites and park facilities are also valuable carbon sinks functioning as long-term carbon reserves.

As a result of their function as carbon sinks, soils play a very important role in climate protection, which should be taken into account during planning and authorization processes (Dahlmann et al. 2012). It thus makes sense to protect soils containing a high amount of carbon stock from land use with negative impacts, such as impervious soil coverage. It is also advantageous to re-cultivate existing structures, especially peat soils. The soil buffer within the organic carbon balance is therefore also considered to assess the filter and buffer function of soils (cf. Map 01.12.3).

The calculation based on this map shows that a total of 4.8 million tonnes of carbon are stored in Berlin’s soils. This equals 17.6 million tonnes of CO2.

Berlins total CO2 emissions amounted to approximately 16.5 million tonnes in 2015 (Statistical Office for Berlin Brandeburg, 2018). This means that, in 2015, Berlin’s soils stored more CO2 than was emitted by primary energy consumption.

Methodology

The organic carbon stock in Berlin’s soils are calculated based on the humus quantities [kg/m²] provided by the Berlin Soil Database (Gerstenberg 2013) (cf. Map 01.06.05 Humus Quantity). Based on the results of the research project “Berlin’s peatlands and climate change “, the calculation of organic carbon stock from humus quantities was altered slightly compared to the method used in 2010 (Gerstenberg 2017). To calculate the organic carbon stock for all of Berlin, the carbon contents were multiplied by the area of the Berlin block structure.

The determined organic carbon stock of Berlin’s soils are estimates only and may be inaccurate at times, due to the methodology. This is the case as the humus contents presented in the Berlin block structure are based on the soil associations map which only functions as a concept map in some cases (cf. Map 01.01). In addition, the humus content, the thickness of the mineral top soil horizons and the peat layers containing humus, as well as the bulk density are estimated in some cases. By integrating the results of the research project “Berlin’s peatlands and climate change “ in 2014, data on location, dimensions, peat thickness, bulk density and the humus / carbon ratio of bogs could be improved greatly (Klingenfuß et al. 2015). Nevertheless, Map 01.06.6 Organic Carbon Stock can only approximate reality. The determined organic carbon stock are divided into six levels, according to Tab. 1.

Tab. 1: Organic carbon stock levels

Tab. 1: Organic carbon stock levels

01.06.7 pH Values of Topsoil

Description

The pH value (the negative logarithm to the base 10 of the hydrogen ion concentration) influences the chemical, physical and biological properties of the soil (soil reaction). It affects the availability of nutrients and pollutants, and provides information about the ability of the soil to neutralize acids or bases. It is important for the filtration and buffering capacities of soils. Thus, at low pH values, no acids can be neutralized in the soil, the heavy-metal connections increasingly dissolve, and the available nutrients are largely washed out.

Methodology

The pH values were derived from existing documents for the soil associations, taking land use into account. The data were essentially taken from the profile sections in Grenzius (1987). Some values have been supplemented by expert assessments, predominantly by using a great variety of different soil-scientific reports. If no measurements were available, the values were assessed using data of comparable uses or comparable soil associations. In addition to the representative values (typical pH values) for the topsoil and the subsoil, the maximum and minimum values were also determined.

On the map, only the pH values of the topsoil are shown, since they are more important for determining soil functions (cf. Map 01.12) than the pH values of the subsoil; pH values of the topsoil also display greater differences, largely influence by use.

The pH levels were determined according to the Bodenkundliche Kartieranleitung (Soil-scientific mapping guidelines, 1994), ranging from 1 to 12. This facilitates a differentiation of the soil reaction according to its alkalinity or acidity, ranging from extremely alkaline to extremely acidic (cf. Tab. 1).

Tab. 1: pH levels according to Bodenkundliche Kartieranleitung

Tab. 1: pH levels according to Bodenkundliche Kartieranleitung

01.06.8 Sum of Exchangeable Basic Cations in the Topsoil (S-Value)

Description

Exchangable cations present in the soil are usually divided into acidic and basic cations. The former include primarily hydrogen ions (H ions). Acidic cation also include those, which trigger hydrolysis when released into the soil solution, and thus release H-ions such as aluminium (Al) in particular. Their sum is known as the H-value. Basic cations are primarily calcium ions (Ca2+), potassium ions (K+), magnesium ions (Mg2+) and sodium ions (Na+), and, in agricultural soil (after fertilizing), also ammonium ions (NH4+), although calcium (Ca2+) usually predominates, with more than 80%. Their sum is known as the S-value. Its concentration can be measured in cmolc/kg, and its quantity in molc/m². The S-value percentage of the exchangable cations is known as the base saturation.

The S-value thus describes the quantity of the cations provided by the soil which is relevant for plant nutrition, and constitutes an important indicator of soil fertility.

Methodology

The quantity of exchangable basic ions (S-value) of the topsoil (here, 0 – 3 dm) can be calculated by multiplying the effective cation exchange capacity (KAKeff) by the base saturation, also taking into account bulk density and the share of coarse soil.

The effective cation exchange capacity calculations are demonstrated in Map 01.06.09. The base saturation may be derived from the pH value (in calcium chloride, CaCl2 measurement).

The base saturation is determined based on the pH value typical of the location of the topsoil (cf. Map 01.06.07) according to Tab. 1. Linear interpolation is then carried out between the pH levels of this table.

Tab. 1: Relationship between Alkaline Saturation (Bs) in % and pH (CaCl2) of Mineral Soil Zones in Berlin

Tab. 1: Relationship between Alkaline Saturation (Bs) in % and pH (CaCl2) of Mineral Soil Zones in Berlin

S-values are categorized into levels 1-10 (extremely low – very high), as shown in Tab. 2.

Tab. 2: S-Value levels

Tab. 2: S-Value levels

The categorization of low level values is carried out in small intervals, in order to show the fine gradation necessary for an evaluation of the function “habitats for rare and near-natural plant communities “ in low-nutrient soils (cf. Map 01.12.1).

01.06.9 Mean Effective Cation Exchange Capacity (KAKeff)

Description

The effective cation exchange capacity (KAKeff) represents the quantity of cations bound to soil colloids, taking into consideration the charge of the organic substances, strongly dependent on the pH value. The exchangeable cations are bound to clay minerals and humus colloids. In neutral to slightly acidic soils, calcium (Ca), magnesium (Mg), potassium (K) and sodium (Na) dominate the sorption complex; in acidic soils, e.g. pine and heath locations, aluminum (Al), hydrogen (H) and iron (Fe) predominate. The binding capacity of organic substances is considerably higher than that of clay minerals. The strength of the bond formed with organic substances is pH-dependent, while the bond with clayey minerals is not pH-dependent. The binding capacity of humus thus drops with the pH value. Clayey and humus-rich soils with a neutral soil reaction can therefore bind considerably more nutrients and pollutants, and prevent a washout of these substances into the groundwater, compared to sandy, humus-poor locations. The effective cation exchange capacity is therefore useful for describing the nutrient and pollutant binding potentials of soils.

Methodology

The KAKeff of the soil associations is derived from the main soil type of the topsoils and subsoils (Tab. 1). The topsoil is assumed to have a depth of 0 – 3 dm; the subsoil a depth of 3 – 15 dm. The exchange capacity of the humus (Tab. 3), corrected by a pH-dependent factor (Tab. 2), is added to the KAK of the main soil type. Both the humus contents and the thickness of the humus layer may differ, depending on soil formation and use, which are also part of calculating the KAK. Therefore, different use-specific values are ascertained for each soil association.

Tab. 1: Average KAK Values of the Soil Types

Tab. 1: Average KAK Values of the Soil Types

Tab. 2: pH factors to determine the effective KAK of the humus share, according to the Bodenkundliche Kartieranleitung

Tab. 2: pH factors to determine the effective KAK of the humus share, according to the Bodenkundliche Kartieranleitung

Tab. 3: Relationship between Humus Content and Potential KAK

Tab. 3: Relationship between Humus Content and Potential KAK

The values ascertained were divided into five levels, ranging from “very low “ to “very high “, according to the Bodenkundliche Kartieranleitung (Soil-scientific mapping guidenlines, 1994) (Tab. 4).

Tab. 4: Effective Cation Capacity Levels

Tab. 4: Effective Cation Capacity Levels

01.06.10 Saturated Water Permeability (kf)

Description

Saturated water permeability (saturated water conductivity, kf value) indicates the permeability of completely water-saturated soils. It depends on the soil type and the bulk density of the soil. Loose soils with high sand contents therefore have a considerably higher permeability than clay-rich soils consisting of boulder marl, for example. Saturated water permeability is important to assess soil wetness, filtration properties, susceptibility to erosion and drainage efficiency of soils. Saturated water permeability is measured in m/s or in cm/d.

As a rule, terrestrial soils display non-saturated water conditions, with only a portion of the pores filled with water; at such non-saturated conditions, water movement is considerably slower. In addition, a large portion of the available water is absorbed by the plants and is no longer available for relocation. As measuring the unsaturated hydraulic conductivity (ku) is very complex and laborious, no accessible data are available in the Bodenkundliche Kartieranleitung (Soil-scientific mapping guidelines, 1994). The verified values of saturated hydraulic conductivity are hence used in scientific practice as a rough measure.

The influence of coarse soil was not taken into account.

Methodology

The kf value for the main soil textures of the topsoil (0 – 10 cm depth) and the subsoil (90 – 100 cm depth) was extracted from Tab. 1. The combined kf value for the topsoil and subsoil is the harmonic mean of the topsoil kf and the subsoil kf. The kf values listed in the Table depending on soil texture are based on the effective bulk density of Ld3, which corresponds to the mean for Berlin soils.

Tab. 1: Water Permeability in Water-Saturated Soil (kf value) by Soil Type at the Mean Effective Retention Density of Ld3, Supplemented by Medium-Decomposed Peat (Z 3) at Medium Substance Volume (SV 3)

Tab. 1: Water Permeability in Water-Saturated Soil (kf value) by Soil Type at the Mean Effective Retention Density of Ld3, Supplemented by Medium-Decomposed Peat (Z 3) at Medium Substance Volume (SV 3)

For the representation on the map, the saturated water permeability results have been categorized into six levels, ranging from very low to extremely high (1 – 6), as shown in Tab. 2.

Tab. 2: Classification of Water Permeability in Water-Saturated Soil

Tab. 2: Classification of Water Permeability in Water-Saturated Soil