Long-term Development of Selected Climate Parameters 2013

Berlin-Alexanderplatz

Site

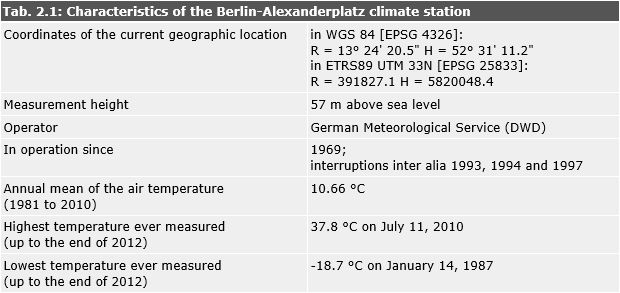
Tab. 2.1: Characteristics of the Berlin-Alexanderplatz climate station

Tab. 2.1: Characteristics of the Berlin-Alexanderplatz climate station

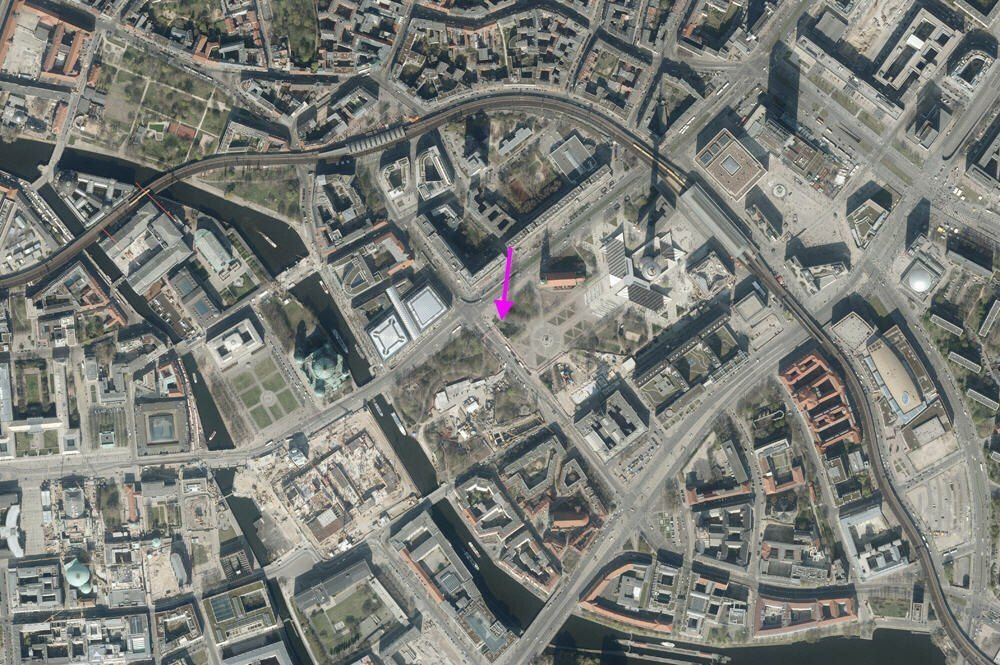
Photo 2.1: Location of the Berlin-Alexanderplatz station (see arrow mark)

Photo 2.1: Location of the Berlin-Alexanderplatz station (see arrow mark)

Photo 2.2: View of the Berlin-Alexanderplatz station

Photo 2.2: View of the Berlin-Alexanderplatz station

The Berlin-Alexanderplatz station lies directly in the city centre of Berlin at the corner of Karl-Liebknecht-Straße and Spandauer Straße (cf. Photo 2.2). The river Spree flows about 350 m west of the current site of the station. The surroundings of the station are characterised by dense and partly high buildings and only very few, mostly smaller green spaces. Due to the inner-city structure at the measurement site, this station exhibits by far the highest nocturnal air temperatures among the Berlin stations and is treated nationwide as a representative inner-city climate station by the German Meteorological Service (DWD). Unfortunately, some measurements were missed in the past, some because of replannings at and near the old measurement site at the foot of the television tower (cf. Berliner Morgenpost on August 6, 2011). The fixed station has existed at the site described above near St. Mary’s Church and the Neptune Fountain since 2012.

The station values used for the investigation start on January 1, 1981, and exhibit some interruptions (mainly in the years 1993, 1994 and 1997) that partly affected the calculation of the annual values, in particular the annual mean values (see the original values within the Excel tables).

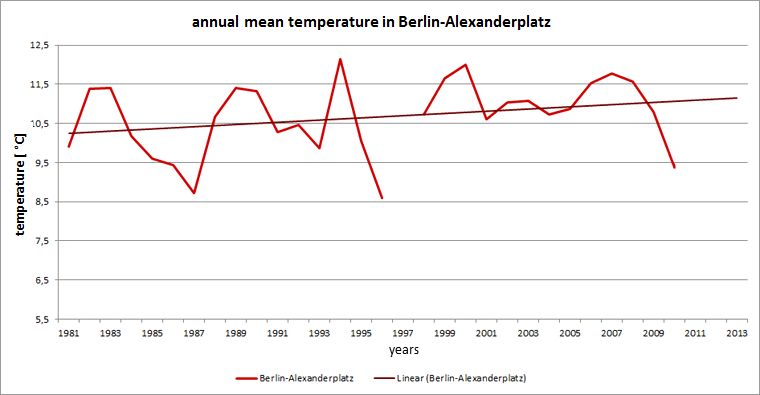
The temperature history of the Berlin-Alexanderplatz station is shown in Figure 2.1 for the years 1981 up to July 2011. The gap caused by the missed measurements in the 1990s is clearly visible. As mentioned, the measurement series is regarded nationwide as representative of an inner-city temperature history. With an average value of 10.66 °C, it shows by far the highest value of the six stations being compared here. The annual average value was 9.90 °C at the start of the temperature records being evaluated, in 1981, and increased to 11.04 °C in 2012.

Developments, trends

Fig. 2.1: History of the annual mean temperature at the Berlin-Alexanderplatz site in the long-term time interval 1981 to 2010

Fig. 2.1: History of the annual mean temperature at the Berlin-Alexanderplatz site in the long-term time interval 1981 to 2010

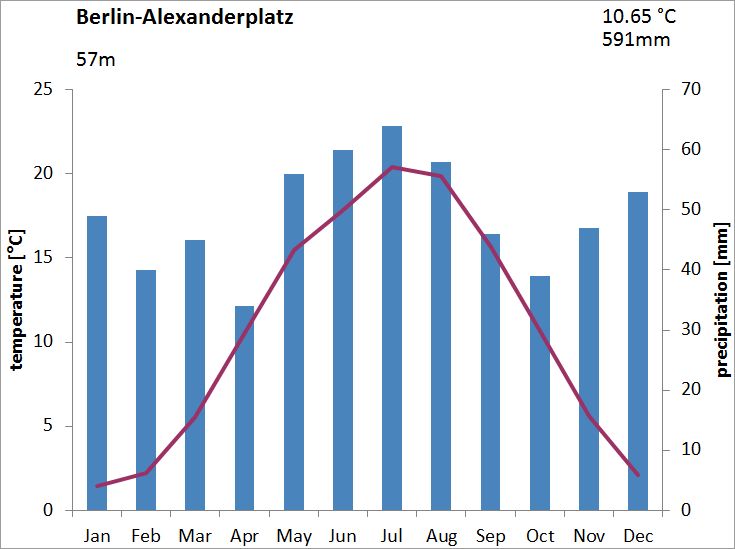
The climate diagram for the Berlin-Alexanderplatz station is shown in Figure 2.2. The maximum of the annual total precipitation lies in the summer months; by contrast, the lowest amounts of precipitation occur in the transitional seasons.

Fig. 2.2: Climate diagram for the Berlin-Alexanderplatz station for the long-term time interval 1981 to 2010

Fig. 2.2: Climate diagram for the Berlin-Alexanderplatz station for the long-term time interval 1981 to 2010

The very high number of tropical nights is notable in Figure 2.3, given that tropical nights are very rare in Germany so far. At most DWD stations there is less than one tropical night per year on average (DWD, accessed on March 15, 2016).

Here the exceptional inner-city location of the station compared to the vast majority of other official climate stations has a marked effect. The trend of the summer days and hot days also shows the special situation of this station (cf. also Fig. 1.2 and 1.3).

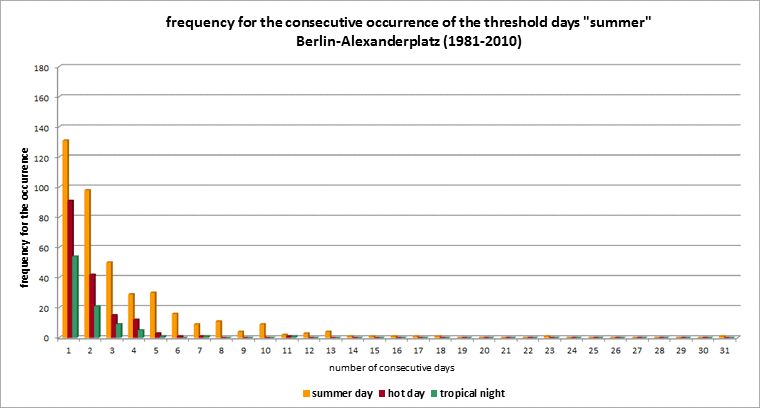
Note the period from July 18 to July 28, 2006, during which temperature values above 30 °C were measured every day, as well as the period from July 19 to July 29, 2006, during which the criteria of a tropical night with temperature values of 20 °C and higher were fulfilled every night (cf. Fig. 2.4).

Fig. 2.3: History of the threshold days summer day, hot day and tropical night for the Berlin-Alexanderplatz station for the long-term period 1981 to 2010

Fig. 2.3: History of the threshold days summer day, hot day and tropical night for the Berlin-Alexanderplatz station for the long-term period 1981 to 2010

Fig. 2.4: Frequency of the occurrence of consecutive summer days, hot days and tropical nights for the long-term period 1981 to 2010 at the Berlin-Alexanderplatz station

Fig. 2.4: Frequency of the occurrence of consecutive summer days, hot days and tropical nights for the long-term period 1981 to 2010 at the Berlin-Alexanderplatz station

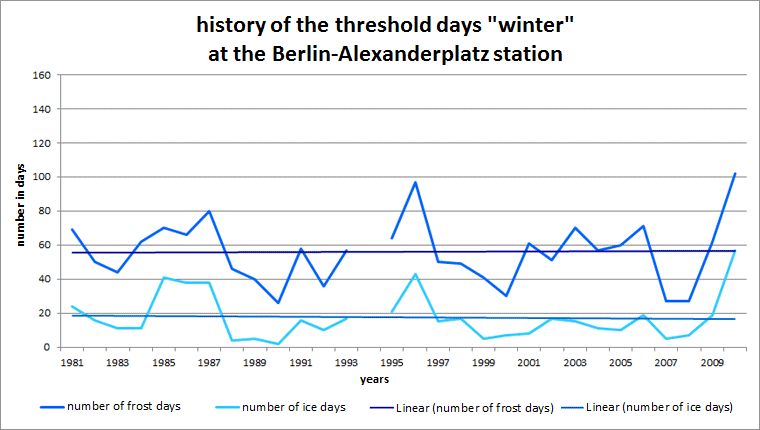
Due to the higher temperatures in the inner city of Berlin, the number of frost days and ice days is significantly lower than at other measurement sites. However, a trend towards a decrease in the number of these threshold days cannot be ascertained. The number of frost days remained nearly constant at the Berlin-Alexanderplatz measurement station over the last 30 years. The number of days with a maximum temperature of at most 0 °C decreased by only one day in this period (cf. Fig. 2.5).

Fig. 2.5: History of the threshold days frost day and ice day at the Berlin-Alexanderplatz station for the long-term period 1981 to 2010

Fig. 2.5: History of the threshold days frost day and ice day at the Berlin-Alexanderplatz station for the long-term period 1981 to 2010