Climate Model Berlin - Analysis Maps 2005

Map Description

The following is a common description for all single evaluations of the model calculations. Links to the individual main emphasis areas are provided for faster orientation in the text:

  • Near-ground temperatures (10 PM);
  • Near-ground temperatures (6 AM);
  • Air exchange and air-mass currents (10 PM and 6 AM) in the entire area.

The model calculations were started every day at sundown, and continued until sunrise the following day. The points in time, at which the model results are to be readout, can, in principle, be chosen freely (minutes up to hours). The time segments 10 PM and 6 AM were evaluated and represented in the form of maps for the individual climate parameters. The 10 PM point in time represents the reversal from an irradiation to an exradiation situation shortly after sundown, and stands for the beginning of a phase with great cooling-down dynamics in the variously structured spaces in the urban area. The 6 AM point in time shows the maximum cooling-down within the urban structure.

In the following, single exemplary results of the model calculations for the entire urban area will be briefly described. Fig. 3 provides a summary of the respective climatological parameters evaluated.

Near-Ground Temperature, General Remarks

The representation of the near-ground temperature field involves the grid instrument of temperature at the near-ground layer of the atmosphere (0-5 m above ground). If several land uses with different area shares are present within a grid cell, the temperature shown is calculated from the proportional weighting. Thus, the simulated temperature values are comparable only for larger areas with a uniform or comparable land use with ground-bound measurements.

Decisive for the temperature distribution are the land-use dependent soil and surface characteristics, as well as their interactions with the atmospheric processes in the near-ground boundary layer. Within the soil, heat and temperature conductivity are of importance in this regard. The greater the heat conductivity of the soil, for example, the faster and more deeply heat can penetrate into the corresponding material – but also: the faster it can escape again.

The surface composition of natural and artificial areas determines, via the albedo (reflection capacity) and the emissivity, the quantity of energy available in the short and long-wave ranges of radiation for warming/cooling. Finally, the turbulence condition of the near-ground atmosphere plays a major role in the transportation of perceptible and latent energy to and from the ground.

All processes mentioned are interconnected via the energy balance of the soil, and determine the temperature of the surfaces and the layers of air above them.

Near-Ground Temperature

The temperature conditions of the near-ground atmosphere 10 PM in the entire area are shown in Map 04.10.01. Due to the great variety of differences determined by land use of these effect quanta, a strongly structured spatial distribution of near-ground temperatures is simulated. Within the early nighttime hours (10 PM) the main land uses stand out against each other in a characteristic manner.

At this time, the wooded areas are approx. 1 K cooler than the surrounding open fields, and considerably colder than the built-up areas.

The open areas are heated up strongly during the day, and cool down after sundown just as strongly. Due to the relatively high evening base temperature, this cooling has on the whole not yet progressed sufficiently at the chosen point in time to reach the level of the cooler wooded areas.

Urban areas stand out considerably from their surroundings by an overall higher temperature level. However, the temperature distribution is spatially differentiated strongly in built-up areas, since, e.g., grid cells with detached house buildings, core areas, industrial areas and transportation facilities show strongly differing ground and surface characteristics. Moreover, the higher mean temperature level is interrupted by inner-city parks like the Great Tiergarten and the Tempelhof and Tegel airports.

Depending on the individual surface characteristics of the various land uses, the ground will cool down differently strongly during the night; Map 04.10.02 shows the temperature distribution at 6 AM.

While this cooling is very low for bodies of water, due to their good heat-accumulating qualities, open areas like fields and meadows show a strong drop in temperature. In wooded areas, the crowns of the trees protects the near-ground atmosphere below from cooling off strongly; therefore, forests stand out in the temperature distribution as relatively warm areas.

In the urban areas, cooling is reduced considerably by the presence of heat-storing materials like concrete and stone. For one thing, the quantity of heat stored during the day causes the temperature not to decline so strongly. Moreover, the low wind speeds of turbulent and latent heat currents, which might otherwise remove warm air, are reduced. The urban areas thus remain warmer overall. While the temperature difference vis-à-vis the undeveloped surrounding countryside is typically 2 K during the evening hours, this value increases to K 6 by the early morning hours. These great horizontal differences are not quite achieved in the inner-city open areas. Here, the proximity to the relatively warm built-up areas manifests itself.

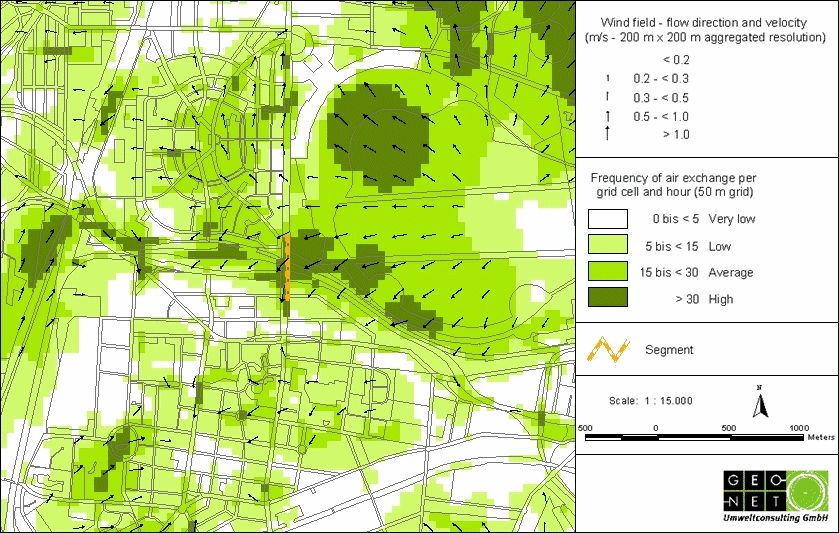
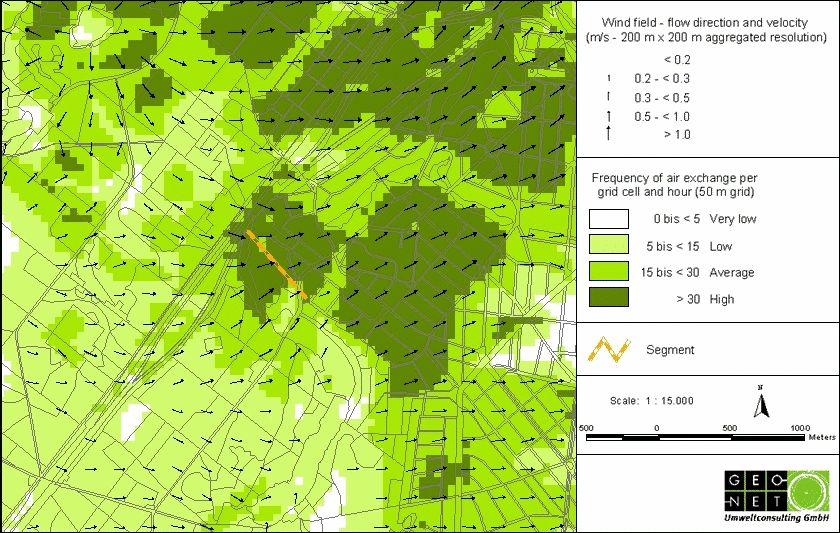
Air Exchange and Air Mass Current as Criteria for Climate Compensation Measures

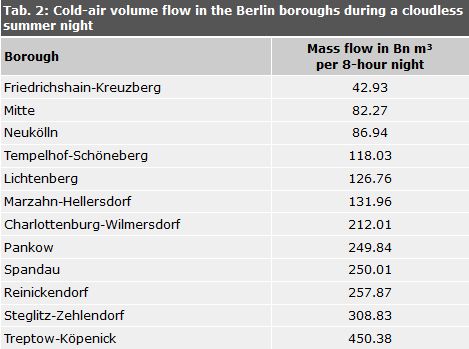
Good ventilation of residential areas can lead to a reduction in human bio-meteorological burdens (cf. Moriske and Turowski 2002). During the nighttime hours, the introduction of cooler air from the surrounding countryside can reduce the temperature level of the warmer air masses stored in the city, thus leading to a reduction of anthropogenic thermal pollution during the summer months. If this introduced cooler air (fresh air) is not burdened by air pollutants, the ventilation will also lead to an improvement in the air-quality situation.

Consequently, evaluation of the ventilation situation requires an appropriate assignment of burdened areas and compensation areas, which can make the appropriate unburdened air available, as well as a circulation system to ensure the transportation of the air mass.

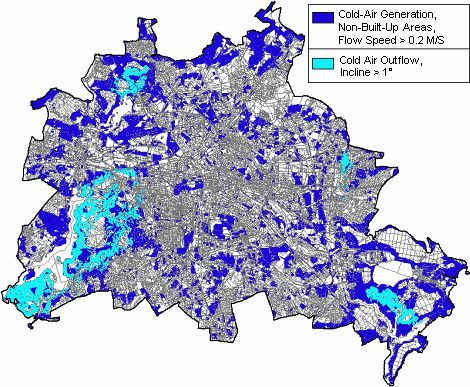
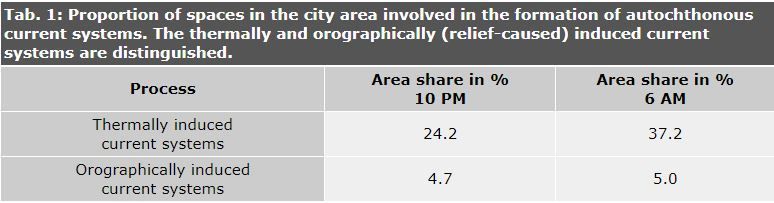
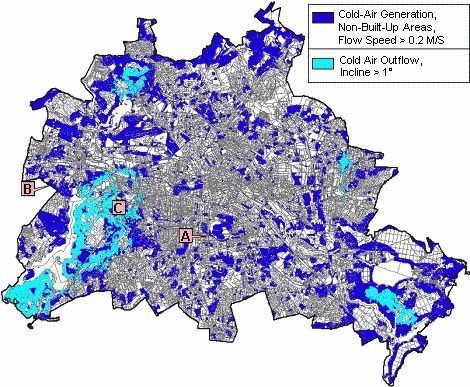
Climate-ecological compensation effects originate in undeveloped areas scattered throughout the urban area. They are characterized by a high vegetal proportion as well as a low degree of sealing of less than 20%, and improve the local climatic situation even in the densely built-up cores areas of Berlin (cf. Maps 04.10.03 through 04.10.06).

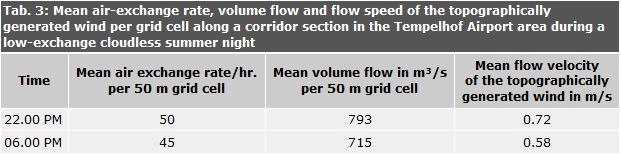
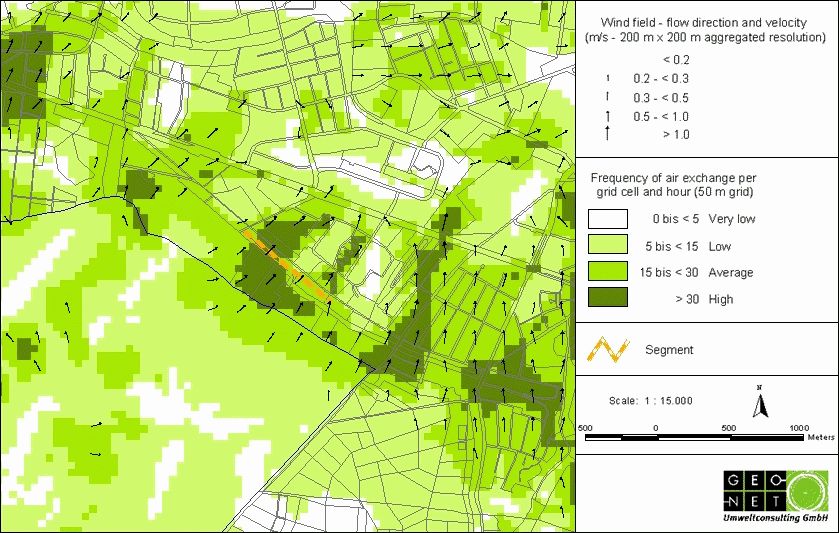
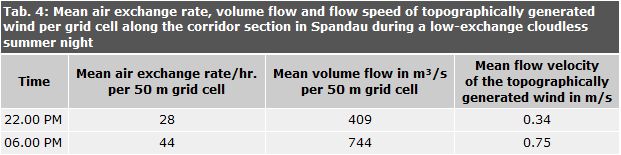
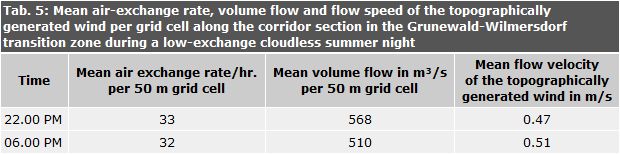
The compensatory effect is produced via topographically generated (thermally) and/or orographically induced current systems. The following delimitation criteria were used to identify the open areas which provide neighboring built-up areas with fresh and/or cold air, and to be able to assign them to the various exchange processes. The self-generated compensation currents should achieve at least a speed of 0.2 m/s in climate-ecologically relevant open areas during a low-exchange, cloudless summer night. The compensation currents can be described as slope or valley winds if slopes or valley-floor inclinations of > 1° occur. Thermally induced current systems can be found in the relatively flat areas (cf. Fig. 6).

Areas involved in cold-air generation or cold air out-flow in the urban areas of Berlin during a low-exchange cloudless summer night

Fig. 6: Areas involved in cold-air generation or cold air out-flow in the urban areas of Berlin during a low-exchange cloudless summer night (10 PM; grid resolution: 50 m)

Significant compensation can be expected from the large coherent forest and parkland areas which are very extensive, particularly on the edge of Berlin. Due to the high cooling rates during the evening and nighttime hours, these areas can be considered important cold-air provision areas. Table 1 shows the proportional space of the city area involved in the formation of topographically generated winds and cold-air outflows:

Tab. 1: Proportion of spaces in the city area involved in the formation of autochthonous current systems. The thermally and orographically (relief-caused) induced current systems are distinguished.

Tab. 1: Proportion of spaces in the city area involved in the formation of autochthonous current systems. The thermally and orographically (relief-caused) induced current systems are distinguished.

Thus, more than 30% of the city area is involved in the formation of compensation flows, with the proportional area increasing slightly over the course of the night from 28.9% at 10 PM to 42.2% at 6 AM. This increase can be explained by the fact that additional undeveloped areas are involved in the cold-air generation process, particularly in the northeast of Berlin as well as around the Müggel Lake and in the Grunewald forest.

However, the result is that while in the early morning a larger undeveloped area is involved in cold-air generation with a current speed > 0.2 m/s, this occurs at a lower level than at 10 PM. A comparison of the mean air-exchange rates of all grid cells in the entire urban area shows notably that the mean cell value climbs from 14.4 at 10 PM to 17.4 at 6 AM. On the other hand, the maximum cell value of 93.1 drops to 90.6. Thus, while the mean air exchange rate climbs overall, the maximum values reached at the 10 PM time segment, and the intensity of air exchange, are no longer achieved, due to the increased leveling of temperature differences.

The compensation from the open areas reaches large parts of the built-up areas of Berlin. A city-wide balance sheet yields the following results:

  • About 37% of the built-up areas are reached or penetrated at the 10 PM time segment by autochthonous currents with a speed of at least 0.2 m/s.
  • Over the course of the night, the compensation benefits from the open areas rise, due to the increase of cold air influx from open spaces outside of Berlin, to a spatial coverage of approx. 63% of that portion of the urban area characterized by built-up development (time segment: 6 AM).
  • At the same time, the cold air flow from most intra-urban green spaces is decreasing. This can be traced back to the fact that they are located within a warmer vicinity and thus the cooling-down in the course of the night is less intense compared with the open spaces outside of Berlin.

Due to the close interaction between built-up areas and open areas, Berlin has a high climate-ecological compensation potential overall. However, cold-air out-flows account for a relatively small share of this. They occur extensively primarily in the following areas:

  • the eastern Havel shore along the Grunewald;
  • the eastern edge of the Grunewald; and
  • south of the Great Müggel Lake, in the Berlin Bürgerheide City Forest.

Large, linearly shaped open areas with relatively low surface friction function as air-stream channels for cold-air transportation. In this regard, three areas of the Havel and Spree Valleys are significant. First, the Havel section between Pichel Lake and Ruhlebener Straße which conducts cold air toward the borough of Spandau along an approx. 3 km corridor; second, Rummelsburg Lake, a part of the Spree, stands out as an area through which cold air streams from old Treptow and from the Plänterwald woods toward Rummelsburg; and finally, a section of the Dahme should be mentioned, along the Grünauer Straße-Regattastraße corridor. These results coincide with the results of a report of the German Meteorological Service (DWD 1996).

However, due to the hardly distinctive orography, such relief-determined ventilation lanes are rather rare. An essential contribution to the transportation of cold air from the countryside surrounding Berlin into the urban area cannot be ascertained; rather, only some parts of the river valleys within the urban area function as air-stream channels.

As examples of the compensation provided by open areas, three locations are discussed in detail under Map Description/Supplementary Notes so as to elucidate the dynamics of the cold air balance in the border area of cold-air producing open area to the built-up areas.

In conclusion, let us address the cold-air balance of Berlin as a whole. For this purpose, the air mass current is to be used, in which cold-air movement is quantified on the basis of 10 PM values in an 8-hour night. Accordingly, 2.3 trillion m³ of cold air are moved in the urban area of Berlin in a low-exchange cloudless summer night. This corresponds to a flow-through rate of 0.29 trillion m³ of cold air per hour. The total mass of cold air moved, broken down by borough, is shown in Table 2.

Cold-air volume flow in the Berlin boroughs during a cloudless summer night

Tab. 2: Cold-air volume flow in the Berlin boroughs during a cloudless summer night

The borough-related results coincide with the expectations with regard to size and location within the urban area. It is apparent here that such core areas as Friedrichshain-Kreuzberg or Mitte, with high degrees of built-up areas and of sealing, have relatively weak mass currents. The situation is different in the Boroughs of Pankow, Reinickendorf and Köpenick.

Here, too densely-built areas are apparent toward the city center, but this is compensated for by the large undeveloped spaces in the interaction areas with the surrounding countryside. The non-built-up, cold-air generating areas of the edge boroughs thus make the largest contribution to the cold-air mass current.

Map Description / Supplementary Notes

In the following, extensive additional information is provided on the dynamics and significance of the cold-air balance of open areas, with selected examples. The text completes the contents of the chapter Map Description. The legend classification of cold air volume flow and air exchange is geared to the standardization procedures of the z-transformation as described in the VDI-guideline 3785 sheet 1 (VDI 2008). This statistical approach is related to the local/regional value level and evaluates the deviation of a climate parameter from the average conditions within an investigation area. In order to classify the results, the VDI-guideline defines four evaluation categories (most favourable / favourable / less favourable / unfavourable), with which the classification of the model results complies.

Cold-Air Producing Open Areas and their Effect on Built-Up Areas

In Fig. 7, three locations are identified, which are to provide an example for discussing in a more detailed manner the cold-air balance on the basis of a selected corridor sections of 10 grid cells with 500 m of section length. For the characterization of the dynamics of the cold-air balance, these examples were placed along the boundary area of cold-air-generating open areas and built-up areas. For an overall comparison of the values within the 50 m grid, a mean grid cell value was then determined based on the cells along the corridor section.

As examples of the compensation potential of open areas, transition zones were used: The southwestern section of the former Tempelhof Airport (A) represents a location with an intra-urban character, whereas the Spandau region (B) shows the influence of cold air generation areas at the western outskirts of Berlin. Between these both locations, the example Grunewald/Wilmersdorf © shows an interim location.

Situation of the test areas A, B and C for the clarification of the processes "cold air generation" and "cold-air out-flow" during a low-exchange cloudless summer night

Fig. 7: Situation of the test areas A, B and C for the clarification of the processes "cold air generation" and "cold-air out-flow" during a low-exchange cloudless summer night (10 PM; grid resolution: 50 m)

Example: Tempelhof Airport

For the consideration of the cold air budget at intra-urban locations, the southwestern part of Tempelhof Airport with a 500 m long section along Tempelhofer Damm was selected (cf. Fig. 8). The former Tempelhof Airport shows, due to its size and location within the city of Berlin, a high relevance for urban climate and a significant local contribution for the reduction of summery thermal stress in the adjacent settlement area.

Air exchange per grid cell and autochthonous current field in the area of Tempelhof Airport during a low-exchange cloudless summer night

Fig. 8: Air exchange per grid cell and autochthonous current field in the area of Tempelhof Airport during a low-exchange cloudless summer night (10 PM; grid resolution: 50 m)

With regard to the air exchange rate, two areas with relatively high hourly air exchange rates of over 30 per grid cell are recognizable in the airport area, including its apron area, and the intersection of Tempelhofer Damm and the A 100 freeway. Despite the high air-exchange rate, even in terms of broad extent, the generation of the topographically generated wind over the apron area is impaired by the air terminal both at 10 PM and at 6 AM. Due to its low surface roughness, the street and rail track located in the southwest of the former airport, allows the cold air from the Tempelhof field to flow to a western direction. The range of this flow amounts, starting from the Tempelhofer Damm, to approx. 700 m (cf. Fig. 8). At this time, it is juxtaposed to an eastward cold-air flow from the allotment-garden colonies of the Schöneberg South Terrain, whereas both topographically generated winds extend up to the Alboinstraße.

By 6 AM, the latter topographically generated wind from the allotment-garden area has come to a virtual standstill, while the range of the topographically generated wind starting from Tempelhof Airport has doubled to approx. 800 m and penetrates up to 400 m to the south to Tempelhofer Damm.

Table 3 summarizes the results for the grid cells located along the considered segment. It can be observed, that the calculated values decrease slightly over the course of the night. This is ascribed to the fact, that the temperature level within the developed areas is decreasing and thus reduces the thermal gradient as a “driving mechanism” for air exchange processes.

Mean air-exchange rate, volume flow and flow speed of the topographically generated wind per grid cell along a corridor section in the Tempelhof Airport area during a low-exchange cloudless summer night

Tab. 3: Mean air-exchange rate, volume flow and flow speed of the topographically generated wind per grid cell along a corridor section in the Tempelhof Airport area during a low-exchange cloudless summer night (grid resolution: 50 m)

The average air exchange rate per grid cell decreases from 50 at 22.00 PM to 45 at 06.00 AM, which means a reduction of 10 percentage points. The cold air volume flow also decreases approx. 10 percentage points from 793 m3/s to 715 m3/s. The average flow velocity also decreases for approx. 19 percentage points. In general, intra-urban cold air generating green spaces show the tendency of a decreasing cold air influx in the course of the night. Due to the size of the former airport, the intensity of air exchange processes in the vicinity can be considered as high. Thus, the reduction of cold air influx of the remaining and mostly smaller intra-urban green spaces is often much more distinctive and can disrupt totally.

Example: Spandau

The borough of Spandau is characterized by its location on the outskirts as well as by its urban settlement structures. For this example, a section along the Weinmeisterhornweg with a length of 500 m is considered. The area generating the cold air for this example is located westerly of the Potsdamer Chaussee outside of Berlin in the region Seeburg. As Fig. 9 shows, a high level of air exchange is connected with allotment sites and one-family houses next to the open spaces. Structures with a low density like these act as local ventilation lanes and support the cold air influx into settlement areas. This function is based on the low surface roughness in combination with a high share of vegetation. With air exchange rates of more than 30, these areas are considerably different from the adjacent and more densely developed areas.

At 22.00 PM, the cold air flows beyond the Heerstraße into the built-up area, so that the reach of the cold air amounts more than 600 m. To the east of this position at Fahremundstraße, the cold air flow extends to Blasewitzer Ring. Starting at the Weinmeisterhornweg, there is a flow distance of approx. 1300 m, until the flow speed decreases below 0.2 m/s and the air exchange reduces to a very low level.

Up to 06.00 AM, the dynamic of cold air exchange processes are increasing. Whereas at the begin of the night the penetration of cold air into the build-up areas is geared to structures with a low density, the cold air influx now has an extensive character. Along with this, a high penetration reach of the cold air flow with locally more than 2000 m is observed.

Air exchange per grid cell and autochthonous flow field in the Spandau area during a low-exchange cloudless summer night

Fig. 9: Air exchange per grid cell and autochthonous flow field in the Spandau area during a low-exchange cloudless summer night (10 PM; grid resolution: 50 m)

The intensification of air exchange processes is based on the steadily increasing cold air volume, which is generated by the wide open spaces at the outskirts of Berlin. This interrelation is represented by the determined results (Tab. 4).

Mean air exchange rate, volume flow and flow speed of topographically generated wind per grid cell along the corridor section in Spandau during a low-exchange cloudless summer night

Tab. 4: Mean air exchange rate, volume flow and flow speed of topographically generated wind per grid cell along the corridor section in Spandau during a low-exchange cloudless summer night (grid resolution: 50 m)

The average air exchange rate grows from 28 to 44, which means an increase of 57 percentage points with regard to the 22.00 PM date. A significant increase can also be observed for the cold air volume flow, which is rising from 409 m3/s per grid cell to 744. That means an increase of 82 percentage points. The highest increase of 121 percentage points is showing the mean flow speed, which rises from 0.34 m/s to 0.75 m/s.

Example: Grunewald Forest

With more than 3000 hectares, the Grunewald forest is among the largest wooded areas in the city area. Along a corridor of approx. 11 km, parts of the Boroughs of Charlottenburg-Wilmersdorf and Zehlendorf-Steglitz, located to the east of the forest, profit particularly from the high cold-air productivity. Fig. 10 shows the transition zone from the Grunewald to the detached-home areas in Wilmersdorf; here, the air interchange per grid cell and hour is relatively high, with exchange rates of over 30.

Air exchange per grid cell and the autochthonous current field in the Grunewald-Wilmersdorf transition zone during a low-exchange cloudless summer night

Fig. 10: Air exchange per grid cell and the autochthonous current field in the Grunewald-Wilmersdorf transition zone during a low-exchange cloudless summer night (10 PM; grid resolution: 50 m)

The correspondingly long range of the cold-air flow is most strongly in evidence in Wilmersdorf at 10 PM, with up to 3,000 m, which is due to the low-density detached-home structure of the area. In Steglitz, by contrast, a value of only approx. 1,250 m is achieved, due to the increasing density of the built-up area. At 6 AM, the cold air only penetrates approx. 1,200 to at most 2,100 m into the built-up area.

For the 500 m long section, the mean value of the air exchange per grid cell, the volume flow as well as the flow speed of the topographically generated wind were exemplarily calculated (cf. Table 5). This corridor starts at Auerbachstraße at the AVUS Freeway, and leads to Koenigsallee.

Only a slight decrease of the mean grid cell value in the course of the night is apparent. The air-exchange rate declines by approx. 3 percentage points, from 33 to 32. The same applies to the cold air volume flow, which is reduced some more by approx. 10 percentage points. In contrast, flow speed of the topographically generated wind increases slightly about 9 percentage points from 0.47 m/s up to 0.51 m/s. It must be stated that, despite the decrease of air exchange rate und volume flow, all three climate parameters remain on a high level up to the 06.00 time.

Mean air-exchange rate, volume flow and flow speed of the topographically generated wind per grid cell along the corridor section in the Grunewald-Wilmersdorf transition zone during a low-exchange cloudless summer night

Tab. 5: Mean air-exchange rate, volume flow and flow speed of the topographically generated wind per grid cell along the corridor section in the Grunewald-Wilmersdorf transition zone during a low-exchange cloudless summer night (grid resolution: 50 m)

Conclusion

The evaluation of climate parameters for an intra-urban (Tempelhof airport), a peripherally (Spandau) as well as an intermediate location (Grunewald) have shown the spatial characteristics of cold air dynamics within the City of Berlin. The example Tempelhof reveals the tendency of intra-urban green spaces to have a high level of cold air generation at nightfall and a decrease to the end of the night. Despite that, the flow systems of cold air generating areas at the outskirts of Berlin show their highest level in the second half of the night, after appropriate cold air volume has been generated over the open spaces. The example Grunewald shows characteristics of intra-urban sites as well as peripheral locations and thus has an intermediate position between both situations. With regard to the evaluation of green and open spaces, the position within the investigation area should always be taken into account.