Traffic-related Emissions and Immissions 2002

Statistical Base

Motor Vehicle Traffic Emissions Registry

The Motor Vehicle Traffic Emissions Registry was revived in 2004 because, according to previous experience, this group of polluters is a significant contributor to fine particulate and nitrogen oxide pollution. Traffic counters have been installed in many locations on the main traffic arteries of Berlin since 2001. This data shows the actual traffic patterns in Berlin and is used to design traffic flow. This information is evaluated in the Office of Traffic Management (VMZ) and is used to inform the populace (especially drivers) of traffic conditions and provide routing recommendations to avoid traffic jams through radio broadcasts, the internet, and centrally located sign boards.

Investigation of Traffic Patterns

Since 2002, data from approximately 400 traffic counters at approximately 300 locations on the main street networks of Berlin has been provided by the VMZ. Many of these counters are able to differentiate between passenger cars and trucks. On the basis of this automatically collected data from 2002, exhaust emissions were determined as follows:

processing of counter data from different sources available to the Office of Traffic Management for Berlin for 2002;

integration of available data with a quality weighted summary of all entry data and completion through location related diurnal variation lines;

spatial projection of the location referenced data on the complete arterial street network of Berlin, with results of mid-day traffic counts (DTV) and truck participation;

investigation of those parts of the main arterial street network used by the Berlin Public Transit Authority (BVG) busses according to route data from 2002; and

calculation of emissions with new emission factors from the UBA manual for emission factors, with consideration for the type and function of streets with the help of the IMMISem/air program.

Investigation of Emissions

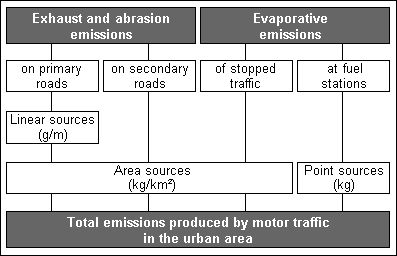
Exhaust and friction emissions from moving traffic, evaporation emissions from standing traffic, and evaporation emissions from petrol stations contribute to the pollution emissions from motor vehicle traffic. Figure 2 shows an overview of the collection system. Emissions at petrol stations are assigned to “small business”.

Fig. 2: Collection systems of the Traffic Emission Registry 2002

Fig. 2: Collection systems of the Traffic Emission Registry 2002

With help from emission models the pollution and CO2-emissions for line sources (main traffic streets) and surface sources (side street networks and evaporation emissions) are calculated.

The exhaust and friction emissions appear as line sources on main traffic and side streets. However, they are only calculated for the main traffic street network as line sources because the aforementioned DTV traffic counts are only available for those streets. Afterwards, the emissions from the line sources are assigned to the framework as surface sources. The emissions from the side street network are, however, derived from assumptions of traffic volume and put directly into the truck framework.

Emission Models for Main Traffic Streets (Line Sources) and Side Street Networks (Surface Sources)

Exhaust emissions from motor vehicle traffic depend on factors which can be summarized into traffic-specific and motor vehicle-specific characteristics.

Traffic-specific characteristics are described by traffic density, i.e. the number of vehicles moving on a prescribed section of a street (source), and their driving style (driving mode). Driving style is organized according to different street types (city center street, side street, main traffic artery with or without traffic control lights, freeway), and function (shopping street, residential street, or access street).

The motor vehicle-specific characteristics, generally expressed by exhaust emissions, are determined by:

  • the kind of engine (four-stroke, two-stroke or diesel);
  • the carburation (carburetor or fuel injection).
  • the type of the fuel (two-stroke mixture, gasoline, diesel);
  • the possible type of existing cleaning systems (regulated and unregulated catalytic converter, recycling of exhaust gases); and, as well,
  • other factors regarding the technical condition of the engine.

Emissions also depend on the driving style (driving mode) and therefore are listed for different driving styles. Cold weather starts, which lead to increased emissions during the warm-up phase of the engine, together with evaporation emissions are considered as vehicle specific points. Here you can find all relevant emissions factors of all emitted substances for each vehicle group (passenger automobiles, light trucks, motorized two wheeled vehicles, busses and heavy trucks), and currently at least five reduction steps (80s ECE cycles, Euro I, Euro II, Euro III, Euro IV, Euro V), and for each street type.

Evaluation of Emissions From Friction and Air Movement Caused by Street Traffic

With today’s knowledge, one assumes that a large part of traffic related PM10-emissions do not originate from vehicle exhaust, but rather from the stirring up of particles lying on the street surface and from tire and brake friction.

Investigations have resulted in the modified EPA formula which is the basis for the calculation of e with IMMISem/air. This formula was developed through measurements on the Schildhornstraße and the Frankfurter Allee and is based on the finding that approximately 50% of the measured added fine particulate in street ravines in not attributable to motor vehicle exhaust but, rather, is caused by motor vehicle related friction (braking and street / tire friction) and air movement.

Figure 3 shows individual output sizes for the calculation of exhaust and friction emissions from traffic, such as driving style, “stop and go” add-ons, cold weather starts etc., as well as the outcomes.

Fig. 3: Emission model for the calculation of quantities of emitted pollutants on main traffic streets

Fig. 3: Emission model for the calculation of quantities of emitted pollutants on main traffic streets

Emissions from motorized two wheeled vehicles cannot be shown due to missing traffic counts on main traffic networks. Their contribution to the total is determined on the basis of average traffic load in Germany and available emission data.

For areas with distinct orography, the street sections should be arranged in longitudinal categories. However, this is not necessary in Berlin.

Emission Model Side Street Networks (Surface Sources)

Fig. 4: EM-NEBEN - Emission model for the side street networks (Surface Sources)

Fig. 4: EM-NEBEN - Emission model for the side street networks (Surface Sources)

The 2002 traffic pollution on side streets was calculated with the help of the traffic routing program VISUM which is based on the relationship between starting and end points. The resulting total driving performance and the proportion of heavy commercial vehicles was assigned to traffic cells in the city. The emissions from exhaust, air movement, and friction in side streets was determined with the emission module from IMMISem/air.

In side street networks, emissions are not calculated for specified sections of streets, but rather as grids for each square kilometre. The driving performance for the grids is determined on the basis of:

  • the general use of the area, divided into
    • residential outskirts;
    • commercial and industry; and
    • inner city and sub centers
  • the number of residents and jobs is differentiated according to
    • trade and service jobs and
    • manufacturing,
  • resulting in source / goal matrixes of motor vehicle traffic.

Further inputs for determination of total emissions of each pollution component for each area corresponds to those for the calculation in the main traffic street network.

Exhaust and Friction Emissions in the City

Table 3 divides the results of motor vehicle traffic in the city of Berlin for 2002 as follows:

a. vehicle use (millions of vehicle kilometres per year);
b. fuel use (tonnes);
c. exhaust and friction emisions from motor vehicle traffic (tonnes per year);
d. according to vehicle type.

Tab. 3: Traffic volume (million vehicle km per year), fuel consumption (tonnes) and exhaust and friction emissions (tonnes per year) arranged by motor vehicle type in the city of Berlin - reference year 2002

Tab. 3: Traffic volume (million vehicle km per year), fuel consumption (tonnes) and exhaust and friction emissions (tonnes per year) arranged by motor vehicle type in the city of Berlin - reference year 2002

The new method of measuring emissions for this KATASTER is also a suitable basis for extended calculations to determine the extent of pollution in streets. The far reaching reorganization of calculation methods allows for only very limited comparisons with previous emissions increases because they are based on a much simpler method of calculation.

Emissions – Results of Stationary Measurements

Street measuring stations are operated to collect pollution caused by motor vehicle traffic with the existing automatic BLUME air measurement street measuring station system. Some changes have taken place in the Berlin air quality measuring system in the past years in order to meet the EU Guidelines and the previously issued amendment of BlmSchG and the 22nd BlmSchV from 2002.
The measurement of these components could be correspondingly reduced because the concentration of sulphur dioxide and carbon monoxide still amounts to a fraction of the limits. At the same time, more attention is being directed towards the regulation of particulate matter (PM10) and nitrogen dioxide, particularly in the proximity of traffic.

Measurement of the Impact of Emissions in Urban Areas

In 2005, at 16 measuring containers (5 on the outskirts of the city, 5 in the inner city background, and 6 at road locations) and at 35 RUBIS measuring locations, air pollution measurements were conducted. Starting in 2005, the RUBIS measurements (small measurement locations with active and passive collectors of nitrogen dioxide, benzene and soot weekly averages) were collected biweekly. The location of the measuring stations is shown in figure 5. The concrete addresses can be taken from the monthly air pollution control reports of the Senate Department of Urban Development (only in german).

Fig. 5: Location of the active and passive collection devices for the collection of weekly samples of benzene, PM10 and nitrogen dioxide, as well as the automatic container measuring locations

Fig. 5: Location of the active and passive collection devices for the collection of weekly samples of benzene, PM10 and nitrogen dioxide, as well as the automatic container measuring locations

The elevation of the measured concentration levels is not totally dependent on the number of motor vehicles and the resulting emissions, but also on the air movement conditions that, on the one hand are controlled by meteorological parameters (e.g. the wind), and, on the other hand, by the style and extent of building construction. As there is a high emission impact registered in streets where buildings are constructed on both sides (street ravines), such as in the Silberstein Street in Neu Koeln, or the Schildhorn Street in Steglitz, while on the city freeway, which carries a noticeably higher traffic volume, lower pollution concentrations are found. Figure 6 shows typical pollution distribution in a road ravine. Such distribution develops if the wind blows (over roofs) from the measuring location in the direction of the road, resulting in a turbulence that is formed in the street ravine. This blows the motor vehicle emissions to the side of the road where the measuring station is located.

Fig. 6: Pollution distribution in a street ravine with measuring range according to the 23. BImSchV and points considered for calculation with the IMMISem/air street ravine model

Fig. 6: Pollution distribution in a street ravine with measuring range according to the 23. BImSchV and points considered for calculation with the IMMISem/air street ravine model

Long Term Trend for Nitrogen Dioxide Concentrations in the City

Until 2005, the results of measurements taken on major streets showed a long term trend (see firgure 7):

  • At all three station categories shown, the NO2 pollution hardly changed during the past ten years. The results at busy streets (red curve) still clearly lay above the European Union limit of 40 µg/m3. The expectation of reduced nitrogen oxide emissions due to improvements to exhaust technology for vehicles has not lead to a decrease of these emissions.
  • By contrast, the results for nitrogen monoxide (NO) from traffic near measuring locations have – as shown by the pink curve – decreased by nearly 40 % during the past 5 years. Nitrogen oxide emissions are decreasing as well, but with only a 30 % reduction between 2000 and 2005.
  • The obvious discrepancy between the development of NO2 pollution which is relevant to air pollution and NOx emissions from street traffic is not a phenomenon that is limited to Berlin, as it is also observed in many European conurbations.
Fig. 7: Long term trend of nitrogen dioxide and nitrogen monoxide data in Berlin

Fig. 7: Long term trend of nitrogen dioxide and nitrogen monoxide data in Berlin

(more information provided under Long-Term Development of Air Quality [only in German])

Long Term Trend of the PM10 Concentrations in the City

Figure 8 shows the development of PM10 and soot concentrations in Berlin and the surrounding area over the past years, when the convervsion of measurements from total particulate to fine particulate matter (PM10) took place.
The red curve shows pollution at three measuring locations near traffic, while the blue and dark-green lines show the concentrations at three measuring locations in populated areas of the inner city and five measuring locations on the outskirts of the city. The measured soot levels at eight traffic measuring locations are shown by the black curve. In order to compare data from urban areas, data from up to four rural stations in Brandenburg was added.

Fig. 8: Long term trend of PM10 and soot concentrations in Berlin

Fig. 8: Long term trend of PM10 and soot concentrations in Berlin

(more information is provided under Long-Term Development of Air Quality [only in German])

Comparison of the curves, reveals the following noteworthy points:

  • The PM10 concentration in the rural environment of Brandenburg equals about half of the PM10 pollution on the main streets the city center of Berlin.
  • The steady decrease in particulate levels that continued until the end of the 90s has not continued during the past few years.
  • In contrast, during the past six years, soot pollution on main traffic streets has decreased by nearly 40 % – a result, amongst other things, of the technical improvement of vehicle exhaust systems, such as the bus fleet of the Berlin Transit Authority, the BVG.
  • The annual variation of PM10 levels is similar at all stations. In particular, the clear resurgence of PM10 levels in 2002 and 2003 is a phenomenon that appears at the same time throughout the city, as well as at stations located on the outskirts of the city. Therefore, to find the cause, one should not concentrate primarily on Berlin’s PM10 emissions, but, rather, the cause is attributable to unfavourable weather conditions and large scale transport of fine particulates.