Green Volume 2020

Map Description

The map illustrates the green volume for block, block segment and road areas. As expected, the highest green volume numbers were recorded for Berlin’s forest areas. The green volume also varied within residential areas, however, which are described in more detail below.

In total, Berlin has a green volume of 4.867 km³, excluding bodies of water. This corresponds to an average green volume number of 5.8 m³/m². The average green volume number of the entire urban area is therefore higher than that of Leipzig (2.4 m³/m²) or Potsdam (4.75 m³/m²), for example (cf. Frick et al. 2020). As expected, more than half of the green volume stems from forest areas (2.697 km³, 16.8 m³/m²). The built-up block (segment) areas house the least vegetation per area (2.6 m³/m²) as do the roads (3.1 m³/m²) (Table 2, cf. Map “Actual Use of Built-Up Areas” (06.01) and Map “Inventory of Green and Open Spaces” (06.02).

In relation to the green volume of road areas, it should be noted that it is mainly roadside trees and vegetation, e.g. tree crowns, protruding from block (segment) areas that influence green volume calculations. Due to the cylinder graph used (cf. Figure 1), the green volume is often overestimated here, compared to other areas.

Tab. 2: Green volume by use group incl. road areas, comparison of the 2020 and 2010 data surveys

Comparing the green volume numbers of 2010 and 2020 reveals an overall decrease of 290 km³ in the total green volume since 2010. A total loss of vegetation area of 2,648 ha was already described in the Map “Vegetation Heights” (06.10.2). Changes in the shares of green volume were inconsistent within the individual use groups. Forest areas recorded the largest loss of green volume with 174.5 km³. At the same time, the green volume number dropped from 17.9 m³/m² (2010) to 16.8 m³/m² (2020) in the forests. There does not seem to be a simple answer as to what caused this loss. Rather, it may be assumed that there were various influences at play at the same time. On the one hand, mature trees dying as a result of the dry summers may have been an influencing factor. On the other hand, consequences associated with human intervention, including the use of wood and the effects of the Mischwaldprogramm der Berliner Forsten (mixed forest programme of the Berlin Forests, only in German) to produce resistant forests with a large variety of species may have had a serious impact.

The built-up areas also displayed a substantial loss of green volume of 174.5 km³. This loss may be attributed to new construction activities and retrospective densification within built-up areas. These, in turn, lead to block (segment) areas with smaller shares of non-built-up, green spaces. Mature trees dying as a result of the dry summers and additional tree felling on private and public properties may also have contributed to this.

Similarly, “Road areas” suffered a loss of green volume of 16 km³. The reasons for this reduction lie both in a general decrease in the number of roadside trees (cf. SenUVK 2020) and in a serious deterioration in the condition of existing roadside trees due to pest infestation (cf. SenUVK 2021).

Conversely, “Other green and open spaces” recorded a slight increase in the green volume from 841.2 km³ to 870.3 km³. The reason behind this growth is spontaneous vegetation that has grown on fallow areas, increasing their green volume number from 3.9 m³/m² (2010) to 4.8 m³/m² (2020). All in all, however, this increase in green volume is mitigated by the loss of green volume of the “Cemetery areas”, which dropped from 10.4 m³/m² (2010, new) to 9.5 m³/m² (2020). This may also be attributed, in some parts, to a loss of mature trees in forest and park cemeteries caused by heat stress.

On closer inspection of the residential development at area type level, striking differences within the built-up area become evident. The green volume numbers of the total areas corresponding to residential block and block segment areas vary between 0.8 m³/m² for the area type “Core area” and up to 4.6 m³/m² for “Villas and town villas with park-like gardens” (cf. Table 3 and Figure 5).

Comparing the green volume numbers for non-built-up parts of residential block and block segment areas, however, the numbers for densely built-up area types also increase in some cases, which applies particularly to the following area types:
  • “Dense block-edge development, closed rear courtyard, 5 – 6 storeys”,
  • “Closed block development, rear courtyard (1870s-1918), 5-storeys”,
  • “Closed and semi-open block development, decorative and garden courtyard (1870s-1918), 4-storeys” and
  • “Block-edge development with large quadrangles (1920s-1940s), 2 – 5 storeys”.

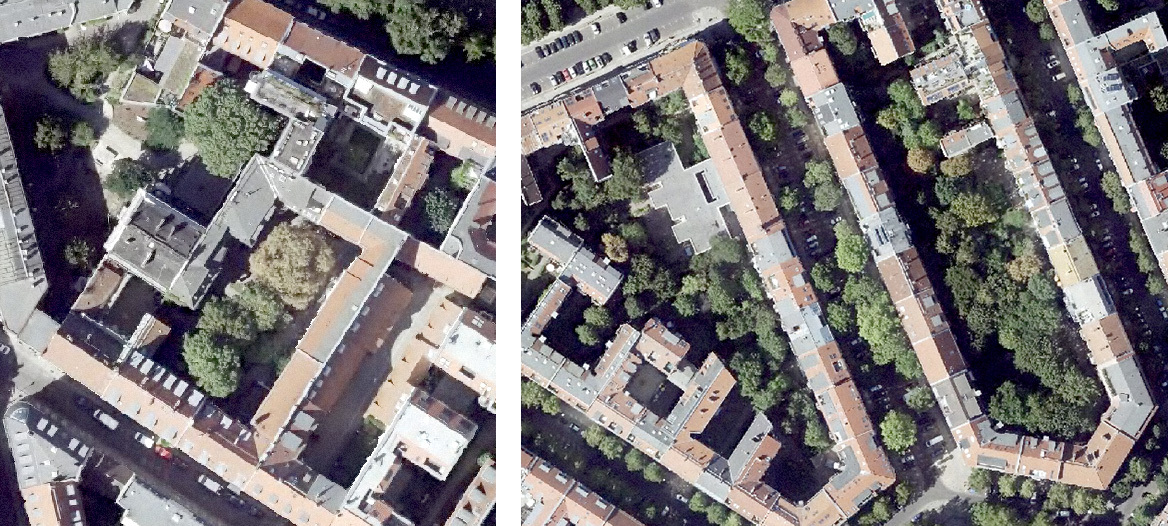
the existing old tree stocks, which occupy a large volume on a relatively small area, play a key role here (cf. Figure 4).

Fig. 4: “Closed block development, rear courtyard (1870s-1918), 5-storeys” incl. old tree stocks (left: example from Gipsstraße to Sophienstraße; right: example east and west of Swinemünder Straße, Background: digital and coloured orthophotos from 2020 (TrueDOP20RGB)

For area types with a more balanced ratio between built-up and non-built-up parts, there is little difference between the green volume numbers of the total block area and the non-built-up part. Furthermore, the green volume numbers in these cases are generally lower than in densely built-up areas (cf. Table 3 and Figure 5). This is also related to greenery, which is often characterised by a high proportion of low-growing vegetation or lawns (“green fringes”) especially in multi-storey residential buildings. The following residential area types of private and rental housing construction illustrate these conditions:
  • “Rental-flat buildings of the 1990s and later”,
  • “Row houses and duplex with yards”,
  • “Detached single-family homes with yards”.

Forest tree estates constitute a special case within the overall green volume picture. These are estates that were built on Berlin’s forest edges. Their gardens and open spaces are often still characterised by stocks of old pine, oak and birch trees. The Berlin Landscape Programme identifies areas of forest tree estates along the following areas: the Grunewald, the Spandauer Forst, in Gatow, in the Köpenicker Forst, in Hermsdorf, Frohnau and Waidmannslust (cf. SenStadtUm 2016b). In contrast to residential areas built on former farmland areas (e.g. the ground moraines of the Teltow and Barnim plateaus consisting of boulder clay and marl), the green volume is clearly higher in the forest tree estates.

Tab. 3: Green volume number by area type

Fig. 5: Green volume number by residential area type

Figure 6 illustrates the distribution of uses at an aggregate level. The range of values for heterogeneous residential area types is discussed above. In this representation, the high values for non-built-up parts under “Cemetery” and “Public and special use” stand out in particular. Structurally, the cemeteries differ mainly in their tree population. Especially the forest and old park cemeteries influence the green volume number positively.

The “Public and special use” category displays the highest green volume number among the built-up uses. This is due to a large number of areas with a high proportion of greenery and trees, e.g. the Olympiapark and hospital locations with old tree stocks, which fall into this use type.

The relatively low green volume number of 1.5 m³/m² for allotments may be explained by the planting and management regulations, which prohibit the planting of large deciduous trees as well as decorative trees and shrubs. These management regulations do not apply to weekend cottage and allotment-garden-type uses, which display a green volume number that is higher by 2.8 m³/m² in comparison. Parks and green spaces are at least partially characterised by trees and shrubs, resulting in the third highest green volume numbers, following those of forest and cemetery areas.

Fig. 6: Green volume number by use incl. roads

Comparing the vegetation volume across the twelve boroughs of Berlin, all boroughs containing extensive forest areas stand out immediately because of their substantial vegetation volume. These boroughs are characterised by their location on the outskirts of the city and a large total area. Treptow-Köpenick is the leading borough, accounting for almost 30 % of Berlin’s total green volume as the most densely forested borough in Berlin. Other boroughs with large green volume numbers are Reinickendorf with the Tegeler Forst, Steglitz-Zehlendorf with the Grunewald, Spandau with the Spandauer Forst, Charlottenburg-Wilmersdorf also with the Grunewald and Pankow with the Bucher Forst (cf. Figure 7, the boroughs are sorted according to the numbering system of the Verwaltungsgliederung (administrative division) of Berlin).

Fig. 7: Green volume and green volume number of Berlin’s 12 boroughs in 2010 and 2020

The decrease in green volume numbers between 2010 and 2020 is most evident in the above mentioned boroughs, which contain large forest areas. The complex causes, especially with regard to the loss of green volume in Berlin’s forest areas, have already been discussed.

Marzahn-Hellersdorf is the only borough that saw an increase in green volume. It is home to numerous fallow and park areas, the green volume of which has increased over the past decade. In addition, redevelopment measures were carried out with the aim of reducing the number of green fringes, located in non-built-up parts of large housing estates, that serve no other purpose.