Content

Strategic Noise Maps 2017

Maps

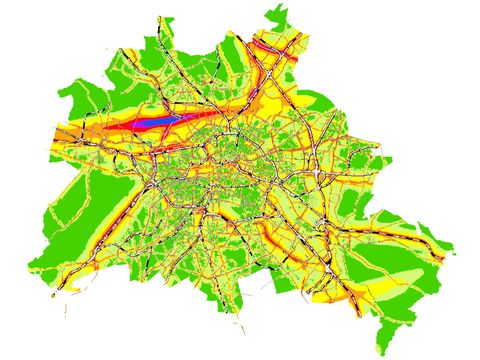
07.05.1 Strategic Noise Map LDEN (noise index day-evening-night) Road Traffic

Link to: 07.05.1 Strategic Noise Map LDEN (noise index day-evening-night) Road Traffic
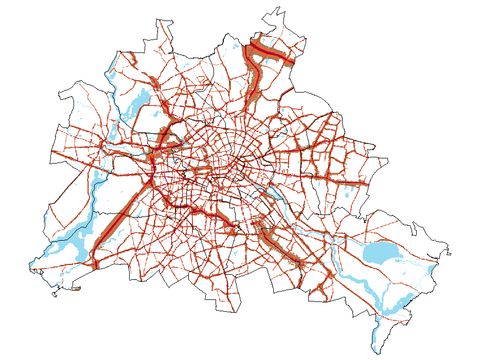
Image: Umweltatlas Berlin

According to EU law, officially defined ‘Strategic Noise Maps’ must be calculated for the main noise sources at 5-year intervals using uniform guidelines. The weighted 24-h mean is presented here in 10 m² grid squares for the noise pollution caused by road traffic. More information

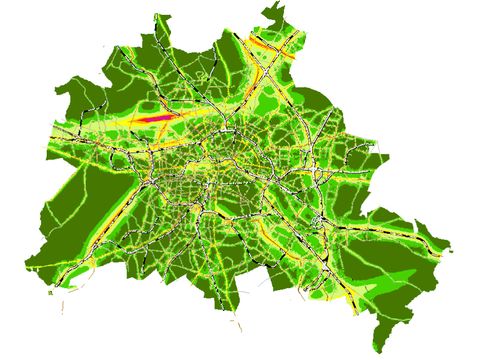
07.05.2 Strategic Noise Map LNight (noise index night 22 pm - 6 am) Road Traffic

Link to: 07.05.2 Strategic Noise Map LNight (noise index night 22 pm - 6 am) Road Traffic
Image: Umweltatlas Berlin

According to EU law, officially defined ‘Strategic Noise Maps’ must be calculated for the main noise sources at 5-year intervals using uniform guidelines. The night-noise index is presented here in 10 m² grid squares for the noise pollution caused by road traffic. More information

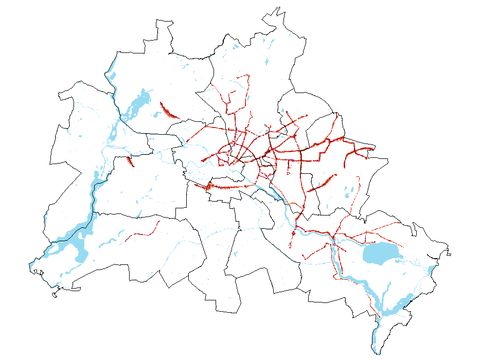
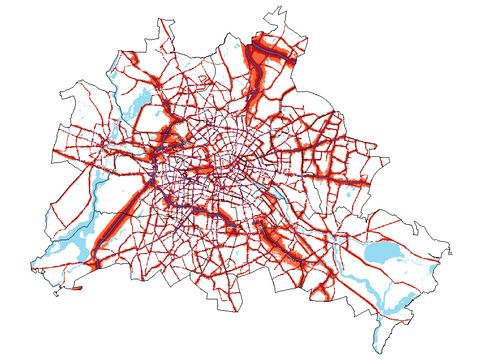
07.05.3 Strategic Noise Map LDEN (noise index day-evening-night) Streetcar and Subway Traffic

Link to: 07.05.3 Strategic Noise Map LDEN (noise index day-evening-night) Streetcar and Subway Traffic
Image: Umweltatlas Berlin

According to EU law, officially defined ‘Strategic Noise Maps’ must be calculated for the main noise sources at 5-year intervals using uniform guidelines. The weighted 24-h mean is presented here in 10 m² grid squares for the noise pollution caused by above-ground tram and subway (U-Bahn) traffic. More information

07.05.4 Strategic Noise Map LNight (noise index night 22 pm - 6 am) Streetcar and Subway Traffic

Link to: 07.05.4 Strategic Noise Map LNight (noise index night 22 pm - 6 am) Streetcar and Subway Traffic
Image: Umweltatlas Berlin

According to EU law, officially defined ‘Strategic Noise Maps’ must be calculated for the main noise sources at 5-year intervals using uniform guidelines. The night-noise index is presented here in 10 m² grid squares for the noise pollution caused by above-ground tram and subway (U-Bahn) traffic. More information

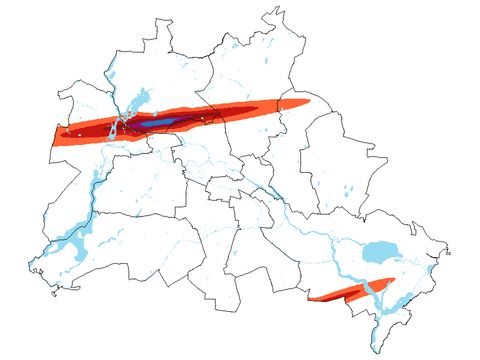
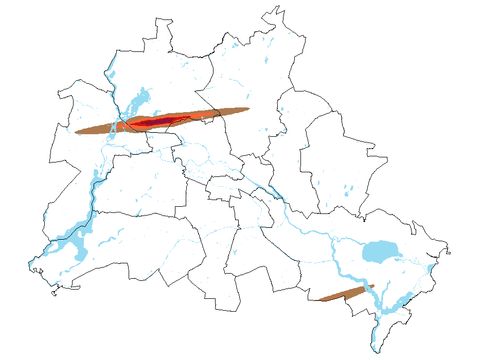
07.05.7 Strategic Noise Map LDEN (noise index day-evening-night) Air Traffic

Link to: 07.05.7 Strategic Noise Map LDEN (noise index day-evening-night) Air Traffic
Image: Umweltatlas Berlin

According to EU law, officially defined ‘Strategic Noise Maps’ must be calculated for the main noise sources at 5-year intervals using uniform guidelines. The weighted 24-h mean is presented here in 10 m² grid squares for the noise pollution caused by air traffic. More information

07.05.8 Strategic Noise Map LNight (noise index night 22 pm - 6 am) Air Traffic

Link to: 07.05.8 Strategic Noise Map LNight (noise index night 22 pm - 6 am) Air Traffic
Image: Umweltatlas Berlin

According to EU law, officially defined ‘Strategic Noise Maps’ must be calculated for the main noise sources at 5-year intervals using uniform guidelines. The night-noise index is presented here in 10 m² grid squares for the noise pollution caused by air traffic. More information

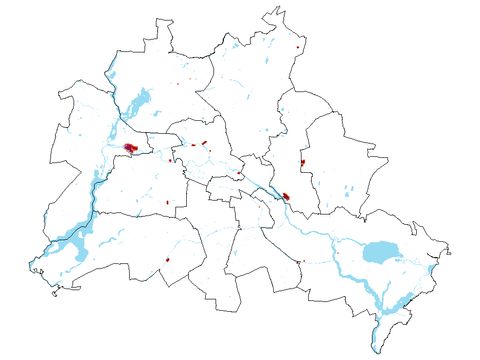
07.05.9 Strategic Noise Map LDEN (noise index day-evening-night) Industry and Commerce

Link to: 07.05.9 Strategic Noise Map LDEN (noise index day-evening-night) Industry and Commerce
Image: Umweltatlas Berlin

According to EU law, officially defined ‘Strategic Noise Maps’ must be calculated for the main noise sources at 5-year intervals using uniform guidelines. The weighted 24-h mean is presented here in 10 m² grid squares for the noise pollution caused by industrial and commercial plants. More information

07.05.10 Strategic Noise Map LNight (noise index night 22 pm - 6 am) Industry and Commerce

Link to: 07.05.10 Strategic Noise Map LNight (noise index night 22 pm - 6 am) Industry and Commerce
Image: Umweltatlas Berlin

According to EU law, officially defined ‘Strategic Noise Maps’ must be calculated for the main noise sources at 5-year intervals using uniform guidelines. The night-noise index is presented here in 10 m² grid squares for the noise pollution caused by industrial and commercial plants. More information

07.05.11 Facade Levels at Residential Buildings Within the Exposure Range of Main Noise Sources

Link to: 07.05.11 Facade Levels at Residential Buildings Within the Exposure Range of Main Noise Sources
Image: Umweltatlas Berlin

According to EU law, officially defined ‘Strategic Noise Maps’ must be calculated for the main noise sources at 5-year intervals using uniform guidelines. The respective noise indices for all main noise sources are presented here for residential buildings, hospitals and schools, for both time periods and defined measurement points. More information

07.05.12 Facade Levels Total Noise LDEN (noise index day-evening-night) Sum of all Traffic Sources at Residential Buildings

Link to: 07.05.12 Facade Levels Total Noise LDEN (noise index day-evening-night) Sum of all Traffic Sources at Residential Buildings
Image: Umweltatlas Berlin

According to EU law, officially defined ‘Strategic Noise Maps’ must be calculated for the main noise sources at 5-year intervals using uniform guidelines. This map presents the overall noise pollution exceeding the EU levels for residential buildings, hospitals, and schools at defined measurement points for the weighted 24-h mean. More information

07.05.13 Facade Levels Total noise LNight (noise index night 22 pm. to 6 am.) Sum of all Traffic Sources at Residential Buildings

Link to: 07.05.13 Facade Levels Total noise LNight (noise index night 22 pm. to 6 am.) Sum of all Traffic Sources at Residential Buildings
Image: Umweltatlas Berlin

According to EU law, officially defined ‘Strategic Noise Maps’ must be calculated for the main noise sources at 5-year intervals using uniform guidelines. This map presents the overall noise pollution exceeding the EU levels for residential buildings, hospitals, and schools at defined reception points for the noise index night. More information

07.05.14 Grid Map LDEN (noise index day-evening-night) Sum of all Traffic Sources

Link to: 07.05.14 Grid Map LDEN (noise index day-evening-night) Sum of all Traffic Sources
Image: Umweltatlas Berlin

According to EU law, officially defined ‘Strategic Noise Maps’ must be calculated for the main noise sources at 5-year intervals using uniform guidelines. This map presents the overall noise pollution exceeding the EU levels for the entire city for the weighted 24-h mean. More information

07.05.15 Grid Map LNight (noise index night) Sum of all Traffic Sources

Link to: 07.05.15 Grid Map LNight (noise index night) Sum of all Traffic Sources
Image: Umweltatlas Berlin

According to EU law, officially defined ‘Strategic Noise Maps’ must be calculated for the main noise sources at 5-year intervals using uniform guidelines. This map presents the overall noise pollution exceeding the EU levels for the entire city for the night-noise index. More information

07.05.16 Sound-Proof Windows Programme 2020/2021

Link to: 07.05.16 Sound-Proof Windows Programme 2020/2021
Image: Umweltatlas Berlin

For residential buildings along very noisy roads and railways of the BVG (if above ground), the State of Berlin promotes the installation of sound-proof windows as part of the Berlin Sound-Proof Windows Programme. This map highlights the façades where noise exposure levels exceed the threshold values of the Sound-Proof Window Programme. More information