Processing for purposes of air quality and noise action planning as “average daily traffic volume (ADT) 2014”
For the purposes of air quality and noise action planning, the data set presented here was further processed.
For the primary road network, the following traffic volumes are indicated as proportions, alongside additional geometry data (permissible maximum speeds, road surface type and condition, identification of bus lanes, etc.):
- motor vehicles
- cars
- trucks < 3.5 t (light commercial vehicles)
- trucks > 3.5 t
- buses
- coaches
- motorcycles
Additional checks and adaptations resulted in an expansion of the original counting network, which also included additional division points for refining the road sections. Overall, this network comprises about 1,766 km of route length of the primary road network (cf. Tab. 5).
Since this network has a more refined section formation as well as additionally included road sections and a distinction between traffic lanes, values had to be acquired in additional surveys, determined via plausibility checks or supplemented via model data in the cases in which they could not be taken over from the existing network of the “Traffic Volume Map 2014”. The section-related information on the respective source of the ADT values for motor vehicles is given in the cell “Source of motor vehicle values” in the data display for the map (cf. map in the Geoportal).
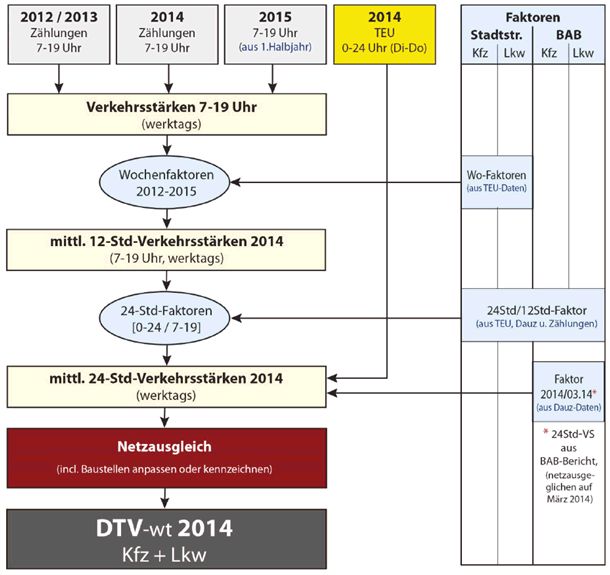
Another essential task in the processing was the conversion of the count values of the average weekday traffic volumes (AWT) to the ADT values presented here (VMZ Berlin 2016).
Since buses, coaches and motorcycles were not captured in the traffic counts, a separate analysis was carried out in this respect, based on the intersection and cross-section counts of the Berlin Traffic Control (VLB). The traffic volumes and shares for cars and light commercial vehicles were also calculated from the existing motor vehicle and truck values of the Traffic Volume Map 2014.
Only calculated values are available for the driving performance in the so-called “secondary network” (roads not included in the counting network); according to these values, around 13 % of the daily driving performance (km/day ADT) determined for the primary road network is attained in this network, which comprises about 3,650 km (= 67 % of routes of the overall Berlin road network) (cf. VMZ Berlin 2016, Table 5).