Population Density 1994

Introduction

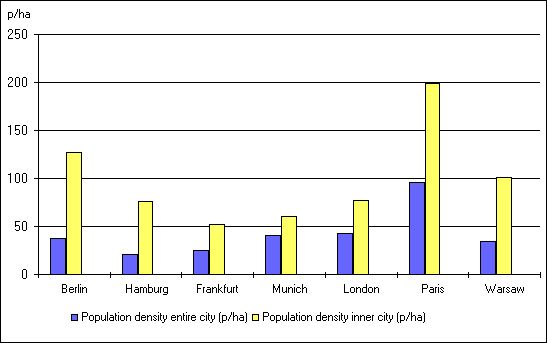
The term population density is a measure of how many people live in a given area. Population density as used here is the number of inhabitants per hectare (1 hectare is an area about 86 yards on a side. 1 hectare = 2.47 acres, or 1 acre = 0.4047 hectare. 640 acres = 1 sq. mile). The population density of Berlin’s entire urban area is 37 people/hectare (p/ha). This figure is in the middle range for German and European cities. Hamburg has an average of 43 % fewer people per hectare. Paris has a population density almost three times greater (cf. Fig. 1).

Fig. 1: Population Density of Berlin Compared to Other Cities, in People per Hectare

Fig. 1: Population Density of Berlin Compared to Other Cities, in People per Hectare

The 127 p/ha population density of the Berlin inner city is above average. Only the Paris inner city is significantly more densely inhabited with 199 p/ha.

The Map of Population Density depicts population density in terms of statistical blocks (cf. Methodology). High population density causes great environmental stresses, such as noise from traffic and air pollution from heating facilities. Residents are dependent on a small number of public green areas for relaxation. These areas are mostly small, heavily visited, often overused, and loud. Private green areas exist only to a limited extent. Some densely populated areas of Berlin are attractive residential areas in spite of this. Some late 19th-century block-style constructions are especially attractive when they have living quarters of generous size, and are complemented by a good infrastructure of small businesses, restaurants, cultural facilities, services, and an extensive public transportation system. Rich urban life flourishes here. This urbanity is missed by many living in the purely residential areas at the edge of the city. These areas have a relatively low population density, a high ratio of open space, and less air and noise pollution.

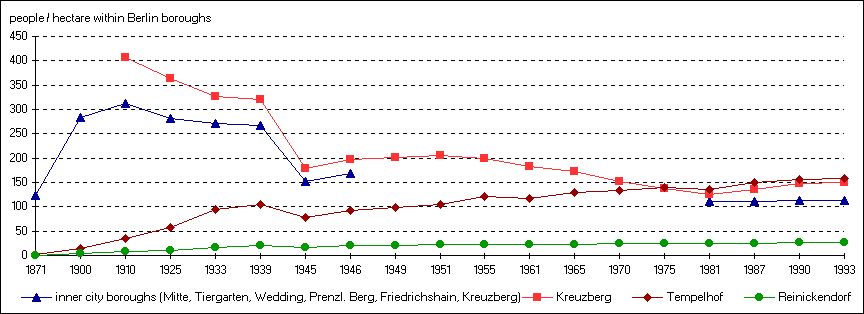
The inner city boroughs of Mitte, Tiergarten, Wedding, Prenzlauer Berg, Friedrichshain and Kreuzberg reached their greatest population density in 1910 with 311 p/ha. Today, the population density of these boroughs has dropped to 114 p/ha, one-third of the peak value (cf. Fig. 2).

Fig. 2: Development of Population Density for Selected Berlin Boroughs (people/hectare within Berlin boroughs)*

Fig. 2: Development of Population Density for Selected Berlin Boroughs (people/hectare within Berlin boroughs)*

h6. *Population figures for inner city boroughs existed only as a total sum for the years 1871 and 1900. No population data for the eastern city boroughs was available between 1949 and 1975. This prevented a calculation of population density for inner city boroughs for these years.

In contrast, the population in the outer boroughs rose continuously, except for a drop in 1945 caused by general war-time conditions. In 1933, the Tempelhof borough had an even higher average population density than the Kreuzberg borough.

A growth in population of up to 300,000 people is expected by 2010. Up to 90 % of the residential space for these inhabitants is to be created by increasing the density of existing structures: putting additional floors on buildings; converting attic and roof spaces into residential units; building on vacant lots; increasing the density of more open construction styles; extending buildings constructed in the post-war period; etc..

Lower population density results not only from high proportions of green and open spaces and lesser degrees of development. Lower density can also be due to a large amount of small business, trade and service use, as well as public facilities, etc.. These property areas are included in calculations of population density.

Detailed and current data bases of population density in specific urban areas are useful for the planning of various public departments. The Department of Urban Planning, for example, uses these figures as a basis for planning such infrastructure facilities as schools, businesses and playgrounds. Landscape Planning uses these figures for analyzing the number and accessibility of green spaces near to residential areas (cf. Map 06.05, SenStadtUmTech 1996a). Knowledge of population density also allows conclusions to be drawn regarding environmental stresses, such as calculating emissions from the use of solvents and cleaning chemicals in private residences, and determining carbon dioxide loads (cf. Map 03.08, SenStadtUm 1994b).