The assignment to classes of the ascertained values for representation on the FSI and LBR map is oriented towards those of the land use plan (FNP) and the building use plan (BNP).
Areas with negligibly small built-up shares were assigned to non-built-up areas, and represented together with them. This involves areas with a land to building ratio (LBR) of less than 0.1, or a floor space index (FSI) less than 0.05. These are usually wooded areas or similar open areas, in which there are a few small buildings, mostly outbuildings. In the case of airports and railroad yards, which come under the category of traffic areas, no calculation of urban structural density was undertaken, since they are certified separately.
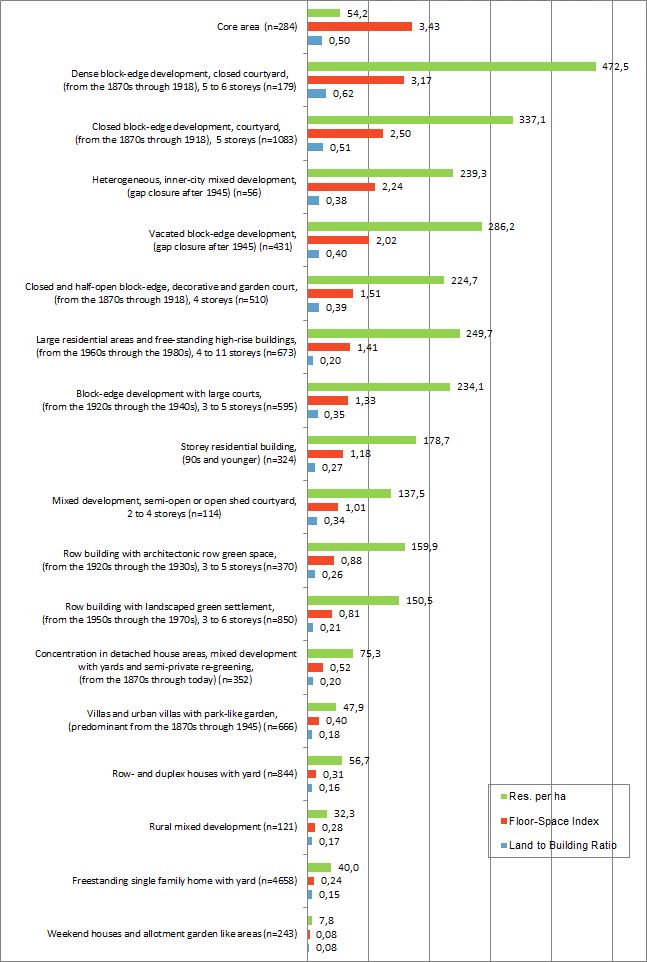
As expected, the maps generally depict a concentric staggered degree of structural use in the municipal area. The more densely built-up areas can be recognized clearly from the deep red to blue colouring. Today’s inner-city area within the urban railway (S-Bahn) Circle Line, built as the “imperial-era tenement belt” around the old centre of Berlin, even today has the highest structural density, with FSIs of between 2 and 4. This is also true of the “new city centre” at Potsdamer Platz and the core areas of the boroughs of Spandau, Reinickendorf, Köpenick, Hellersdorf and Zehlendorf.
On the perifery of the inner city, much of it containing many residential areas of the Weimar period, most areas have an FSI of 1.0 to 1.2.
In the outer parts of the city, detached homes prevail, with low floor space indices of less than 0.5 predominating. The large housing estates of the ’60s and ’70s, and older built-up areas along the main radial traffic routes stand out clearly due to their higher degrees of usage of ground. In particular cases, a high density of development of certain blocks can be seen even in peripheral areas of the city. This usually involves large public service complexes, such as the hospital complex in Buch.
The considerably higher density figures of the numerous local core areas also show the polycentric structure of Berlin, with its core area uses.
The maps enable the localisation of potenital vacant building land in built-up blocks in which the actual degree of structural use is less than the legally permitted proportion. In terms of urban planning discussions of the densification of the city centre, these vacant areas have particular significance.