Calculation of the percolation water rates on an annual and monthly basis, and forecast changes due to climate change
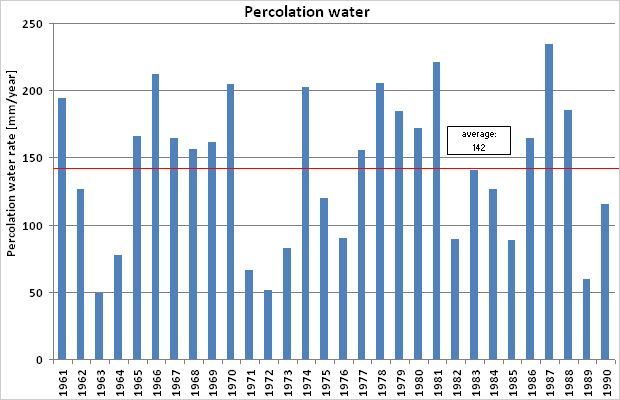
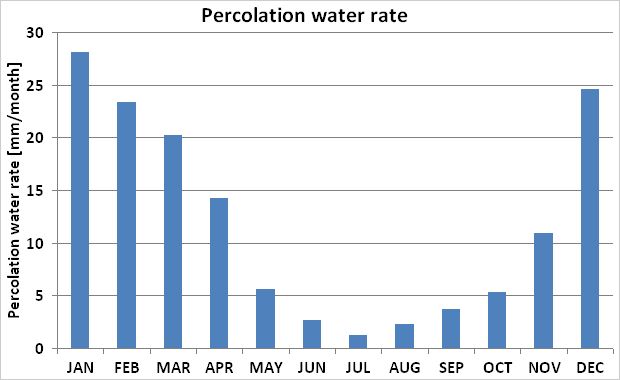
Water balance data calculated with the ABIMO model provide a 30 year long-term mean value. However, in reality, the values fluctuate considerably on an annual basis, depending on the precipitation levels, and are also subject to fluctuations over the course of a year. In the present research project, percolation water rates were calculated with a considerably higher temporal resolution.
Project
The results presented below were developed in the context of the Inka BB research project of the German Federal Ministry for Education and Research (Subsidy Code 01LR0803C), Subproject 23. INKA BB is the acronym for the Berlin-Brandenburg Climate Adaptation Innovation Network. In this research project, which was broken down into 24 subprojects, subproject 23 addressed technologies for climate adapted water management in urban areas in the context of climate change. For this purpose, the climate scenarios developed by the project partner Potsdam Institute for Climate Impact Research (PIK) were incorporated into the various models in order to make statements on issues relevant for water management.
Statistical Base
The input data adopted comprised the land-use categories (cf. Maps 06.01 and 06.02, 2008 edition), the classified degree of impervious coverage (cf. Map 01.02, 2007 edition), the classified depth to groundwater (cf. Map 02.07, 2010 edition), and such soil parameters as usable field capacity and Kf values from the data base of the Berlin Environmental Atlas (cf. Map 01.06, 2009 edition), for approx. 25,000 polygons. Additional soil parameters, such as porosity, were substantiated by reference to the soil associations in the Environmental Atlas (cf. Map 01.01, 2009 edition), using values from the Soil Scientific Mapping Guideline (BGR, 2005). In case of incomplete data sets, plausible assumptions were made, or data was taken from already completed DHI-WASY projects. The result was that 78 different soil types, 156 soil textures, 12 depth-to-groundwater classes and 775 land-use classes were obtained.
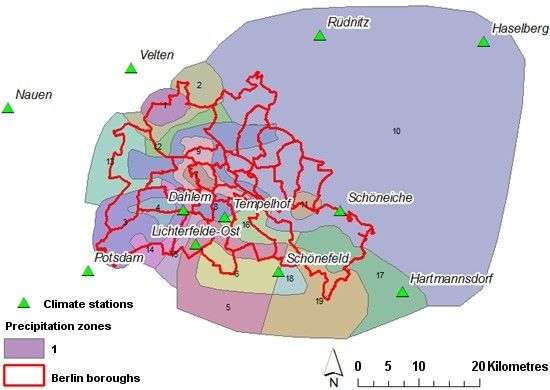
The climate data used were the daily data for precipitation and potential evaporation from 11 precipitation stations in Berlin and the surrounding area. The climate data was gathered by the DWD and made available by the PIK in the context of the INKA BB research project. In order to be able to correctly represent the spatially differentiated distribution of precipitation in Berlin and the surrounding areas (cf. Map 04.08, 1994 edition), the climate data were extracted by means of inverse distance weighting (a geostatistical procedure) for 19 precipitation zones. The spatial distribution of the precipitation zones is shown in Figure 5.