Population Density 1994

Methodology

The spatial reference system was provided by the digital working map of the Environmental Information System (UIS). This working map contains individual statistical blocks with block numbers. Blocks with more than one use are divided into block segments. The numbering and street limit lines of blocks corresponds to those used by the Berlin State Statistical Agency in 1990.

Population density was determined for each statistical block. The size of each statistical block, needed for the calculation of population density, was taken from the UIS Data Base. Figures for the number of inhabitants were assigned to statistical blocks according to the UIS spatial reference system. Classification problems occurred in statistical blocks whose street limit lines and/or numbering was changed by the State Statistical Agency after 1990. Two different methods were used to correlate resident figures derived from the block street limit lines of the State Statistical Agency in 1994 to the block street limit lines and numbering of the UIS.

If one statistical block was subdivided into several new blocks after 1990, the resident figures of the new blocks were added together and assigned into the UIS according to old block numbers and street limit lines.

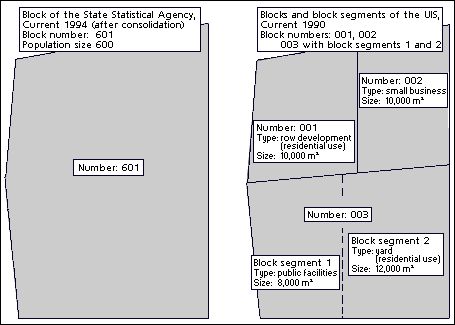
If several blocks of the UIS were consolidated into a new statistical block by the State Statistical Agency after 1990, then first the area type and area size of the individual statistical blocks or the individual segments of a statistical block was determined with the aid of the file of Area Types (cf. Fig. 3).

Fig. 3: Assignment of Population Figures for Redefined Blocks

Fig. 3: Assignment of Population Figures for Redefined Blocks

Because residents are mainly to be expected in areas primarily used for residential use, resident figures were assigned only to these type of blocks or block segments. In the example in Figure 3, the 600 residents of the “new” Block number 601 were assigned to Block 001 and to Block Segment 2 of Block 003 according to the ratio of their area size. Block 001 was thus assigned 273 residents and Block 003 was assigned 327 residents. Block 002 and Block Segment 1 of Block 003 have small business and public facilities. No residents were assigned to them.

Table 1 lists the widely varying average population densities of Area Types. Areas containing sub-areas of greatly different population density were dealt with as in the following example in Figure 3. Block 003, Block Segment 2 is a “Garden” Area Type and Block 001 is a “Row Development” Area Type. One-half of the resident total retroactively determined by calculation for the Garden Type Block 003, Block Segment 2 (327 divided by 2 = 163.5) was assigned to Row Development Type Block 001 (273 + 163 = 436). Figure 3 gives the adjusted resident totals 436 for Block 001, and 164 for Block 003.

Population densities were classified into categories for depiction in the map. In order to portray smaller differences in population density in the lightly populated outer areas of the city, categories in the lower ranges of density are more finely differentiated than for greater population densities (from 151 p/ha).

Blocks not contained in the file “Mandatorily Registered Residents according to Main Residence” were later assigned to the category “Less than 5 residents per hectare”. These were usually green and open areas, small business areas, traffic areas, core areas, public facilities, and utilities areas.