First of all, the breeding bird habitats were certified area-specifically according to the break-down of Flade (1994). By means of an addition of all habitats occurring in a grid square, it was possible to prepare a species list of the indicator species to be expected for these areas (ideal value). By means of the assignment of actually mapped breeding birds, as obtained from the breeding bird atlases, to the grid squares, the actual breeding bird occurrence was determined (actual value). From these ideal and actual values, a balance sheet of the occurrence of breeding bird indicator species in Berlin could then be prepared. Finally, for better assignment, the balance-sheet results were underpinned with a potential avifaunistic evaluation of the habitats (with reference to the index values according to Witt 1991), and a survey of the occurrence of Red Data Book species was compiled.
The Environmental Atlas maps are available in the new Map Application
Balance Sheet of Breeding Bird Population 1994
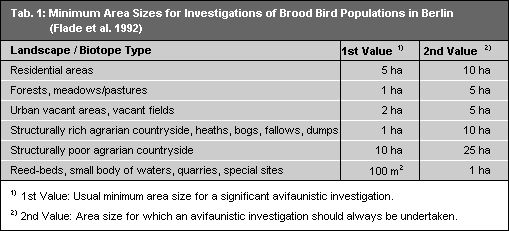
Tab. 1: Minimum Area Sizes for Investigation of Breeding Bird Populations in Berlin
Image: Flade et al. 1992
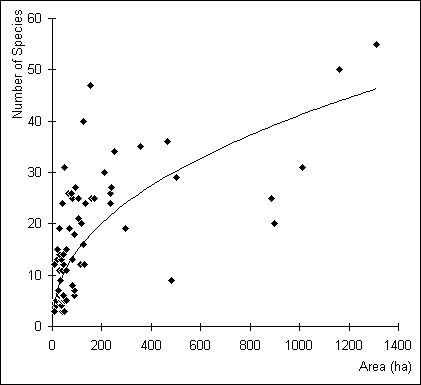
Fig. 3: Species-area Curve for Inland Meadows and Pastures
Image: Flade 1991
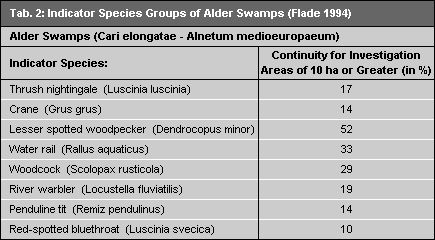
Tab. 2: Indicator Species Groups of Alder Swamps
Image: Flade 1994
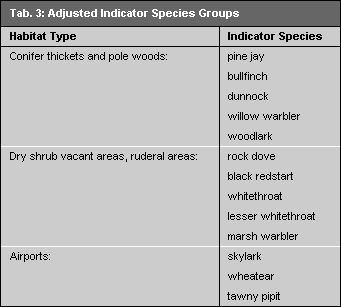
Tab. 3: Adjusted Indicator Species Groups
Image: Umweltatlas Berlin
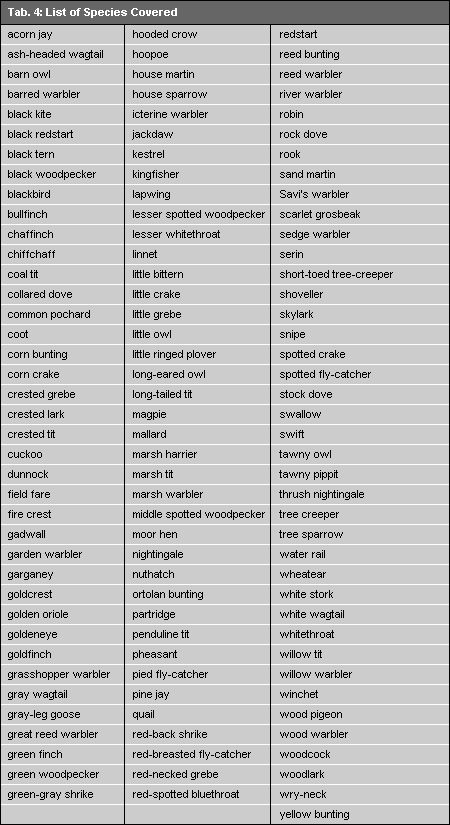
Tab. 4: List of the Species Covered
Image: Umweltatlas Berlin
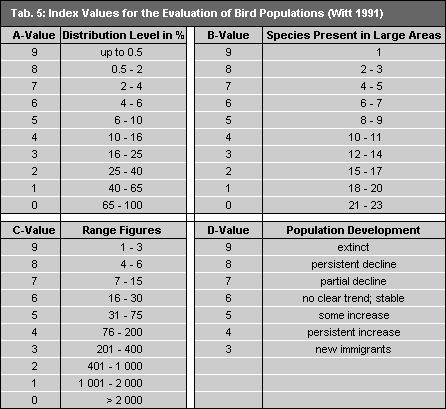
Tab. 5: Index Values for the Evaluation of Bird Populations
Image: Witt 1991
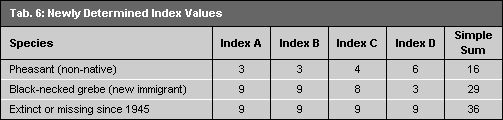
Tab. 6: Newly Determined Index Values
Image: Umweltatlas Berlin

Tab. 7: Potential Avifaunistic Evaluation of Habitat Types
Image: Umweltatlas Berlin
Environmental Atlas Contact
Berlin Senate Department for Urban Development, Building and Housing
Mr. Döllefeld