Surface Runoff, Percolation, Total Runoff and Evaporation from Precipitation 2001

Methodology

Almost ten years ago, a model for calculating the most important quanta of the water balance was developed, programmed and used in cooperation with the Berlin office of the Federal Hydrology Agency. The approximately 25 required basic data or input parameters could be provided by the City and Environment Information System (ISU) for each of the approx. 25,000 single areas. This model has now been used unchanged, albeit with updated data (cf. Data Base).

The runoff model ABIMO developed by Glugla has been created on the basis of models developed as early as the ‘70s for the calculation of groundwater supply, and been expanded to include modules which take into account the special situation of urban areas. This expansion was supported by an expert report by the Institute for Ecology (soil science) of the Berlin University of Technology, and a master’s thesis at the Department of Geography at the Free University of Berlin. The arithmetic implementation carried out by an external software company in addition adapted it to the specific data situation of Berlin.

The calculation method first of all ascertains the actual evaporation, in order to calculate total runoff (precipitation minus evaporation). In the second work stage, the surface runoff is determined as a share of total runoff. The difference between total runoff and surface runoff then constitutes the seepage. Fig.2. conveys an impression of the complexity of this procedure.

Fig. 2: Flow chart of the ABIMO model

Fig. 2: Flow chart of the ABIMO model

Fig. 2a: Content of symbols to the flow chart ABIMO

Fig. 2a: Contents of symbols of the flow diagram of the ABIMO model

Total runoff is calculated from the difference between long-term annual mean precipitation values and real evaporation. Real evaporation as it is actually encountered, as a mean, at sites and in areas, is calculated from the most important quanta precipitation and potential evaporation, and the mean storage qualities of the evaporating areas. Given sufficient moisture input into the evaporation area, the real evaporation value will approach that of the potential evaporation. The real evaporation is additionally modified by the storage qualities of the evaporation area. A higher storage effect (e.g. greater binding capacity of the soil and greater perracination depth) causes higher evaporation.

The connection shown between the mean value of real evaporation over several years on the one hand and precipitation, and potential evaporation and evaporation effectivity of the site on the other fulfills the Bagrov relation (cf. Glugla et al. 1971, Glugla et al. 1976, Bamberg et al. 1981 and Fig.3). The Bagrov relation is based on the evaluation of long-term lysimeter tests, and describes the nonlinear relationship between precipitation and evaporation in dependence on site characteristics. With the Bagrov relation, the real evaporation/potential evaporation quotient (ER/EP), and hence the real evaporation ER for sites and areas without groundwater influence can be ascertained, provided the climate quanta precipitation P and potential evaporation EP (quotient P/EP), and the effectivity parameter n of the quotient are known. The Bagrov method is also used in modified form to calculate the groundwater-influenced evaporation, adding the mean capillary water rise from the groundwater to the precipitation.

Fig. 3: Representation of the Bagrov equation for select values of the parameter n, and dependence of this parameter upon land use and soil type

Fig. 3: Representation of the Bagrov equation for select values of the parameter n, and dependence of this parameter upon land use and soil type

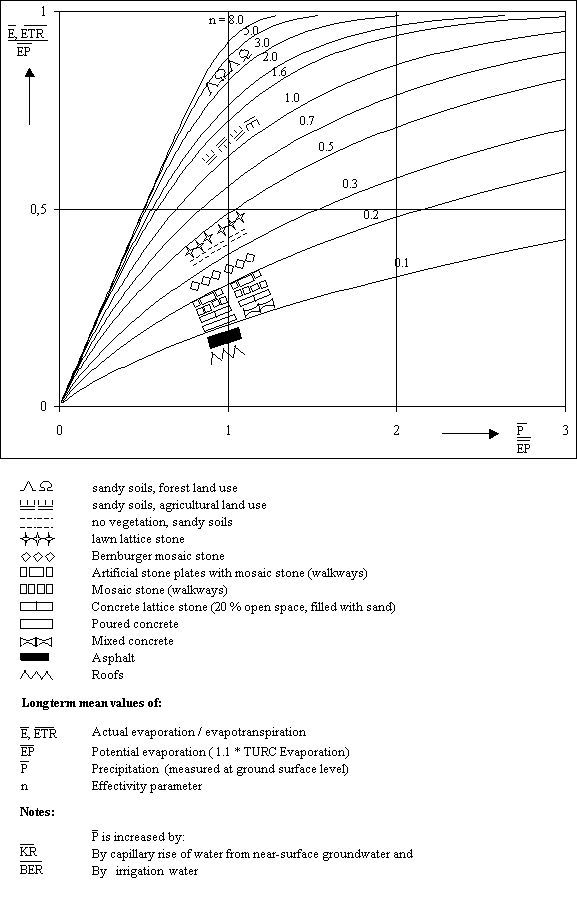
With growing precipitation P, the value of real evaporation ER approaches that of potential evaporation EP i.e., the ER/EP quotient approaches the value of 1. At reduced precipitation P (P/EP approaches the value 0), the real evaporation value approaches that of precipitation P. The intensity with which these boundary conditions are reached is determined by the storage qualities of the evaporating area (effectivity parameter n).

The storage qualities of the site are particularly determined by the use form (increasing storage effectivity in the following order: sealed area, vegetation-free surface, agricultural, horticultural/ silvicultural use) as well as soil type (increasing storage effectivity with higher binding capacity of the soil).

The measure for the storage effectivity of unsealed soil is the usable field capacity as a difference of the humidity values of the soil for field capacity (beginning of water seepage into the ground) and for the permanent wilting point (permanent drought damage to plants). Other land-use factors, such as hectare yield and types and ages of trees, modify the parameter value n. The parameter n has been quantified by evaluation of observation results from numerous domestic and foreign lysimeter stations and water-balance tests in river-catchment areas.

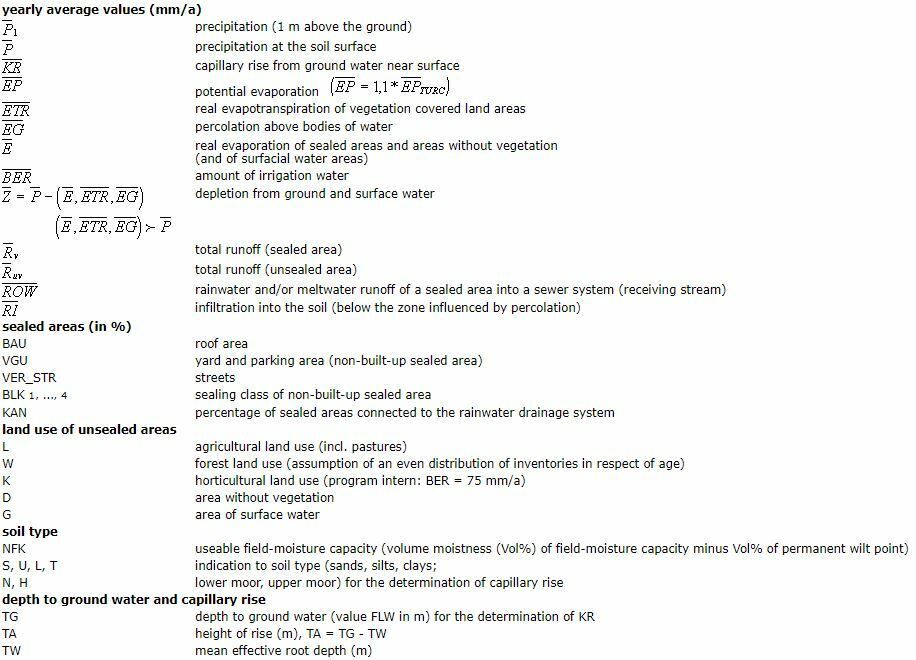
For sites and areas in surface-near groundwater, increased evaporation compared with non-groundwater-uninfluenced conditions occurs in the evaporation-influenced soil zone due to capillary rise of groundwater, depending on the depth to water table and soil qualities. Runoff is reduced. If real evaporation exceeds precipitation, water consumption occurs and the values for runoff become negative (e.g. river and lake lowlands).

Water areas have a higher potential evaporation than land areas, because of higher heat supply (lower reflectivity of the irradiation). For the sake of approximation, the actual water evaporation is stated as equal to this increased potential evaporation.

Selective seepage, e.g. via groundwater charging facilities by the waterworks, has not been taken into account. For gardening use (allotment gardens) a uniform approximation value was added to the precipitation to take irrigation into account.

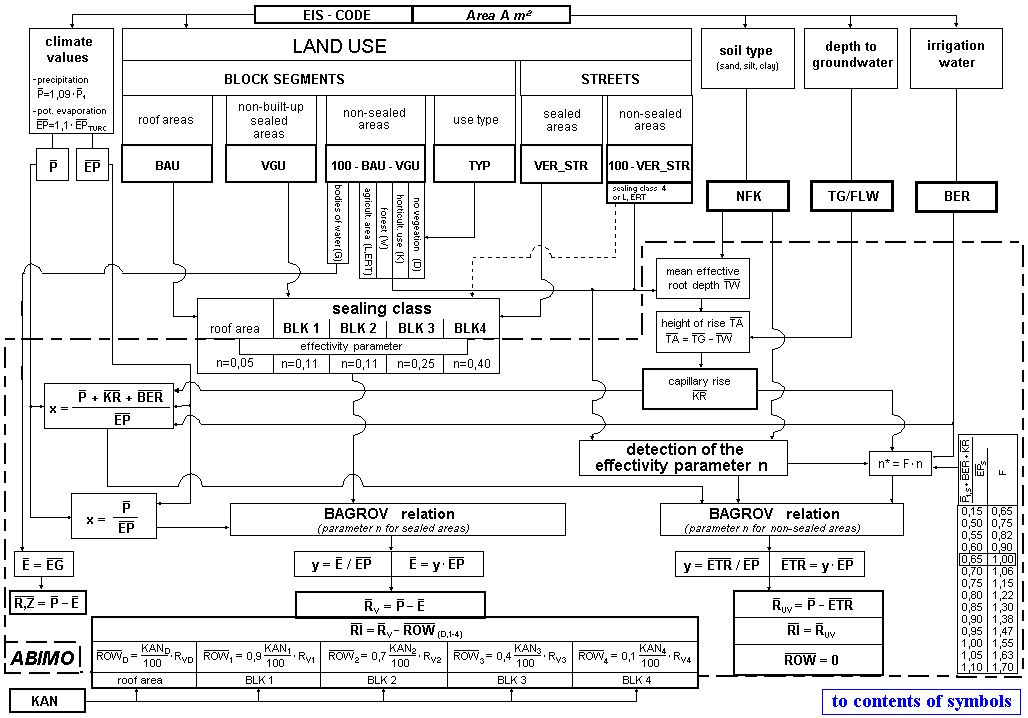
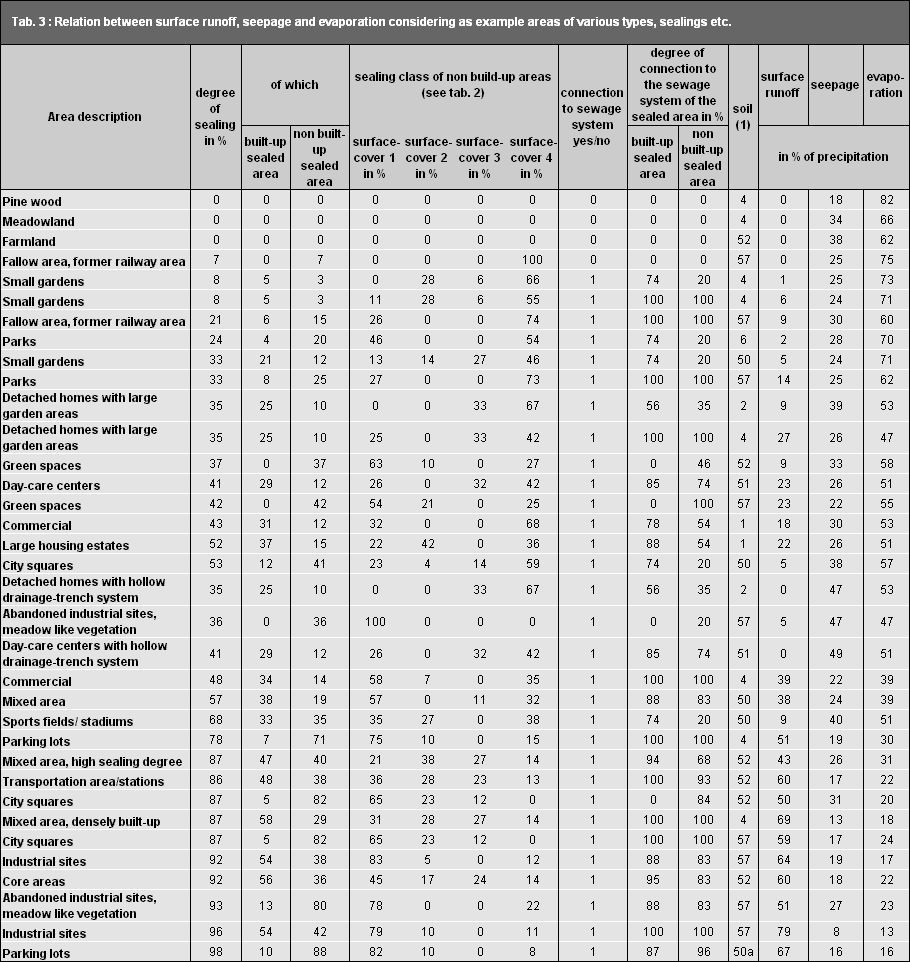
After the mean total runoff has been calculated as a difference between precipitation and real evaporation, surface runoff is determined in a second work step. Surface runoff corresponds to the total runoff on roof areas which drains into the sewage system. Areas not connected to the sewage system thus produce no surface runoff. Non-built-up sealed areas infiltrate a part of their drainage into the sub-surface, depending on the type of surface (surface-cover types). This Infiltration factor is dependent on the width, age and type of the seams. The non-seeping runoff is passed to the sewage system as surface runoff – depending on the degree of connection to the sewage system – or, if the sewage system does not receive it, seeps away at the edge of the sealed areas. Those portions of the precipitation onto roof areas not connected to the sewage system also seep away (cf. Tab. 1). The difference between total runoff and surface runoff thus corresponds to seepage as a basic quantity for new groundwater formation.

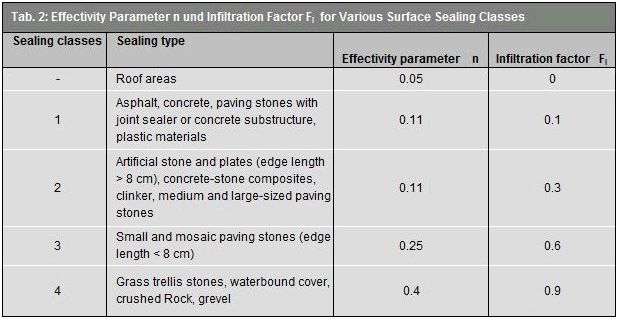
For the application of the method for urban areas, the parameters n and the infiltration factors had to be determined for the various sealing materials. Both lysimeter tests were evaluated with different sealing materials and calculations for wetting loss (cf. Wessolek/Facklam 1997). The quanta selected for the stated parameters are listed in Tab. 2. The change of these parameters due to compression and silting of the joints associated with the ageing process has been taken into account. However, due to still insufficient scientific bases, this information still involves certain uncertainties. Moreover, a different grouping of surface-cover types into surface-cover classes would be desirable from a hydrological point of view.

Tab. 2: Effectivity parameter n and Infiltration factor Fi for different surface-cover classes

Tab. 2: Effectivity parameter n and Infiltration factor Fi for different surface-cover classes

In order to provide an impression as to how the various area uses, sealing parameters and conditions of the sewage system would affect the water balance, the ABIMO model was used for approx. 35 model surfaces with different input quantities; the results are shown in Table 3. The relationship between surface runoff, sealing and evaporation is decisively dependent of the extent of sealing and the passage of rainwater to the sewage system.

Tab. 3: Relationship between surface runoff, seepage and evaporation for sample surfaces of different uses, sealing types, etc.

Tab. 3: Relationship between surface runoff, seepage and evaporation for sample surfaces of different uses, sealing types, etc.

As a result of these calculations, updated long-term mean values for total runoff, surface runoff and seepage are available for each of the 25,000 separate areas. These values have been shown classified in mm/year in these maps; the totals in cu.m./year have also been calculated and averaged. It must be taken into account that the values shown are mean values covering the blocks represented as uniform areas; in fact, however, they have non-homogeneous structures. The runoffs of sealed and unsealed areas have been standardized to average values per block. In addition, the runoff of roadways has been attributed to the adjacent blocks. The maps do not show, for instance, how great the seepage capacity of a square meter of unsealed ground is. For this purpose, another full-coverage and block-referenced calculation has therefore been carried out with changed marginal parameters, i.e., assuming completely unsealed conditions. The results of this calculation are shown in Map 02.13.4.