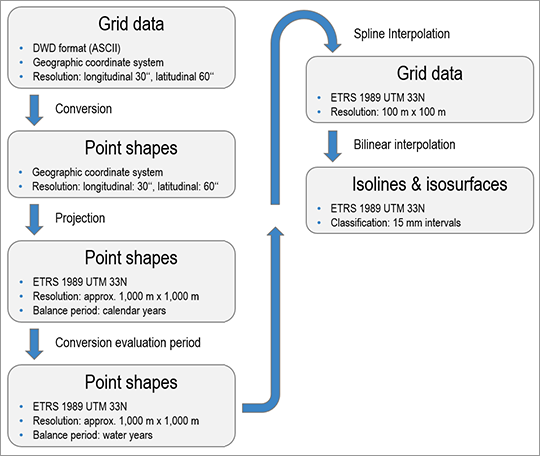
The source data was available in an ASCII format specific to the DWD and in the geographic coordinate system WGS1984. The data was converted into the ESRI shape format using a DWD script and then projected into the ETRS1989 UTM 33N coordinate system that is used in Berlin.
Precipitation data serves as an important base for water balance analyses. The latter is usually balanced according to the water year (discharge year, hydrological year), starting on 1 November. This classification is used as late autumn and early winter precipitation is stored as snow or ice. It does not run off until the following spring.
The 30-year means of the REGNIE precipitation data, however, refer to calendar years and monthly means for the period from 1981 to 2010. As the water year of 1981 begins in November 1980, the means for each month of November and December from 1981 to 2010 had to be converted into monthly means for the period from 1980 to 2009. For this purpose, the monthly precipitation for November and December of 2010 was weighted by 1/30 and then subtracted. Subsequently, the monthly precipitation for 1980, which was weighted the same, was added. The sum of the individual monthly means was then used to derive the 30-year mean precipitation according to water years and its two halves from 1981 to 2010 as presented in Table 1.
Technically, the REGNIE data is grid data. According to DWD documentation, however, the precipitation data should be considered point data, which refers to the centre of each grid cell (grid point). Precipitation is a physiographic process. Its distribution is continuous and steady. Therefore, the transitions between the different precipitation data points in the individual grid cells should also be gradual. To this end, the source data (1 km x 1 km resolution) was interpolated to a resolution that is ten times higher, i.e. 100 m x 100 m. A Spline interpolation of the type “Tension” with a weight of 1 and a search radius of 4 points was chosen as the interpolation method (cf. ESRI 2019a). This method is a good compromise between smoothing values on the one hand and representing the original values in
the grid points as accurately as possible on the other.
Isolines and isosurfaces were generated from the interpolated 100 m x 100 m grid data using bilinear interpolation (cf. ESRI 2019b). Isolines are lines that connect points of equal value. In relation to precipitation, these lines are also referred to as isohyets, i.e. they connect points of the same precipitation. Isosurfaces comprise the areas between two isolines and thus indicate areas with precipitation within a specific range of values.