Map 02.13.3 Total Runoff was only published in the digital edition of the Environmental Atlas. It shows total runoff values in the range of 350-450 mm/a for the highly sealed inner city area (S-Bahn-Ring – City Rail Circle). There were higher values for extremely high sealed areas in the city center and for some industrial areas. Only about 150 mm/a evaporates here, related to precipitation observations (measured in 1 m above the ground) that are about 10 – 15% under the precipitation measured at the soil surface. Loosely built-up outer districts show runoffs of 250-300 mm/a. Berlin had values of only about 150 mm/a. Compared to the runoffs of unsealed outer areas and surrounding areas, Berlin can be viewed as an island of strongly increased runoffs. The reduction of evaporation by sealing and lack of vegetation lead to runoffs 2 or 3 times greater than would occur under natural conditions.
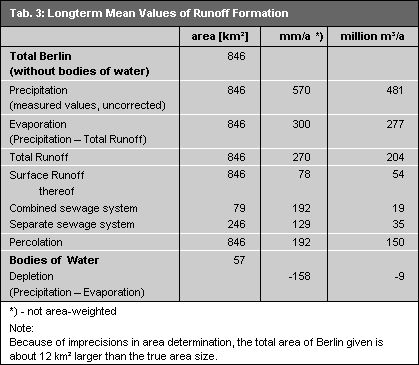
Groundwater depletion, the negative values of runoff formation, only appear in a few regions of low precipitation and lesser depths to groundwater, for vegetation evaporates more water from groundwater than can be conducted to groundwater by precipitation.
The 02.13.1 Map Surface Runoff shows that about 250 mm/a is discharged to the sewage system in inner city areas connected to the sewage system. Peak values are above 350 mm/a. Outer areas in regions connected to the sewage system have about 100 mm/a.
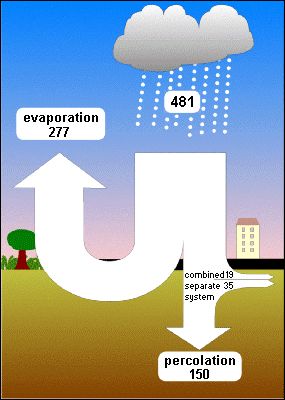
The 02.13.2 Map of Percolation gives an initially surprising picture. It shows that about 120 mm/a percolates in the inner city. This is almost as much as in forests. Clearly higher percolation rates of 200 mm/a are shown in the loosely built-up settlements of outer districts. Regions with a low degree of connection to the sewage system have higher rates of about 300 mm/a. Settlements not connected to the sewage system show percolation of total runoff of about 300-350 mm/a, with maximum values over 400 mm/a.
It may be determined that:
- reduced permeability caused by high degrees of sealing in the inner city is compensated for by infiltration of precipitation. Inner city percolation rates are higher than initially assumed and almost correspond to “natural” conditions.
- the amount of sealing is a secondary factor for percolation. The primary factor is determined by the actual degree of connection to the sewage system. The type of sealing material, i.e. the different infiltration capacities of various sealing types is also an important factor.
- the reduction of evaporation caused by sealed surfaces in loosely built-up areas having low degrees of connection to the sewage system give these areas the highest percolation; about double that of “natural” percolation.
The glacial valley watercourse is marked by permeable sands overlaying groundwater. Percolation to groundwater is direct and complete. Percolation corresponds to groundwater recharge. The ground moraine flat uplands in the Barnim and Teltow areas however, are overlaid with clayey layers of low permeability; these are usually over confined groundwater. The deeply-cut flows here are mainly fed by confined groundwater and/or by way of sandy and thus permeable layers in the ground moraine. Only the (calculated) percolation not discharged through receiving streams could be seen as true feeding of the main water aquifer under the ground moraine. This water reaches the glacial valley watercourse as underground flow. The division is dependent on the specific hydrogeological conditions. A comparison of measured and calculated flows shows, for example, that in the catchment area of the Neuenhagen Mühlenfließ about 35 % of calculated percolation discharges underground into the glacial valley watercourse. The Tegeler Fließ discharges to the surface almost all runoff formed by the percolation of its catchment area.
Evaporation of bodies of water not depicted in the map are about 160 mm/a greater than precipitation. Evaporation removes a total of about 9 million cubic meters of water a year from bodies of water in Berlin.
There is no information to indicate if some highly sealed areas discharge precipitation by way of the sewage system. This is the reason that total runoff in these areas is given as percolation in the map. The degree of sealing and the size of runoff make it seem improbable in some cases that the water actually percolates. It would seem that surface runoff tends to be underestimated and percolation to be overestimated.
The aid of area parameters of the reference areas enabled runoff volumes to be calculated and balanced (cf. Tab. 3).


