Content

Environmental Justice Berlin 2021/2022

Maps

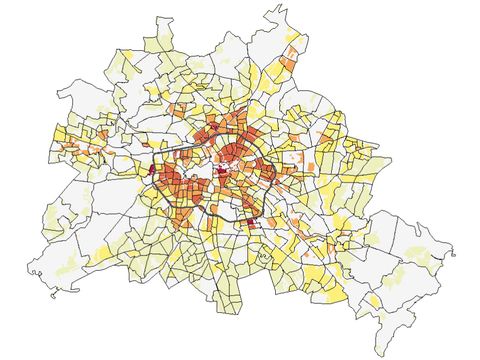
09.01.1 Noise Burden 2021/2022

Link to: 09.01.1 Noise Burden 2021/2022
Image: Umweltatlas Berlin

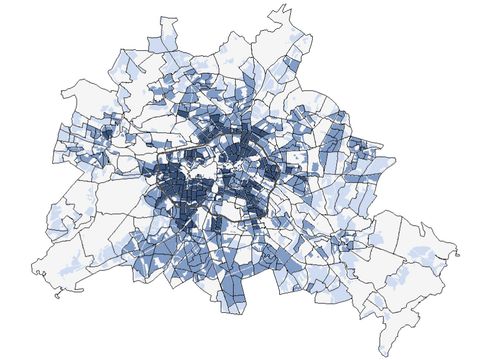
The total noise map (night) was chosen from the set of evaluations of the 2017 Strategic Noise Maps as a starting point for determining the intensity of the burden of core indicator 1 of Berlin’s approach to environmental justice. The distribution indicates that the noise burden is highly impacted by main roads and main railway lines. More information

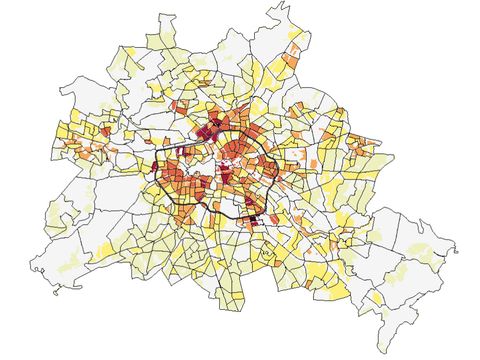
09.01.2 Air Pollution 2021/2022

Link to: 09.01.2 Air Pollution 2021/2022
Image: Umweltatlas Berlin

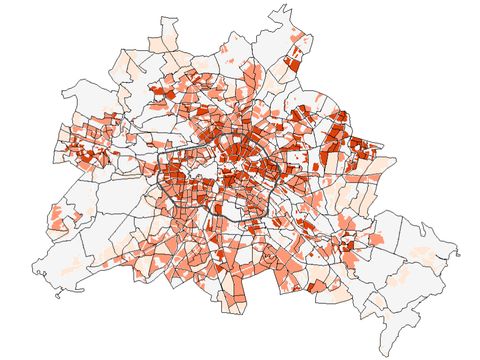
The distribution of primarily traffic-related nitrogen dioxide pollution across the city was used to determine the intensity of the burden associated with core indicator 2 of Berlin’s approach to environmental justice. The burden is most intense in the city centre, where traffic density is highest. More information

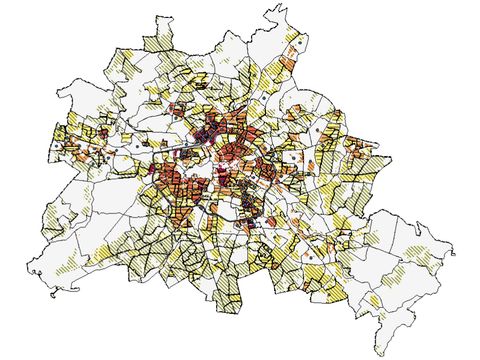
09.01.3 Green and Open Space Supply 2021/2022

Link to: 09.01.3 Green and Open Space Supply 2021/2022
Image: Umweltatlas Berlin

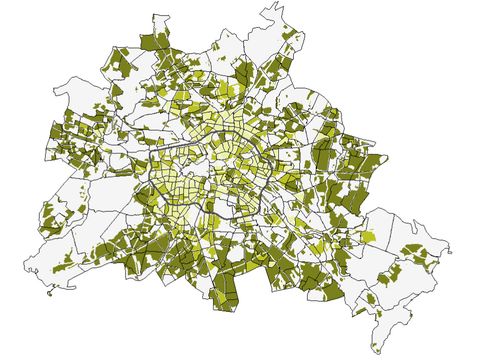
Based on the ‘Analysis for the availability of green space’, a three-stage classification (“bad/very bad”, “medium” and “good/ very good”) was used to establish the degree of availability in relation to the catchment areas in order to determine the intensity of the burden associated with core indicator 3. More information

09.01.4 Thermal Burden 2021/2022

Link to: 09.01.4 Thermal Burden 2021/2022
Image: Umweltatlas Berlin

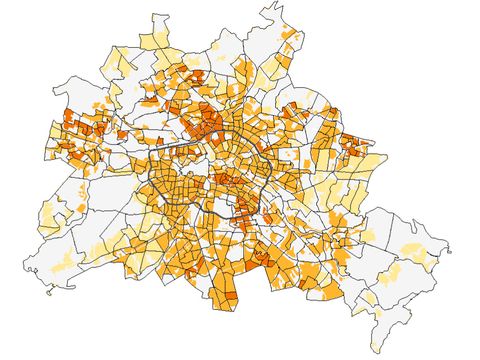
To determine the intensity of the burden associated with core indicator 4, the distribution of the evaluation index PET (Physiologically Equivalent Temperature) was used to assess the daytime situation. At night, the air temperature distribution was used. Both assessments were carried out in three steps at planning area level. More information

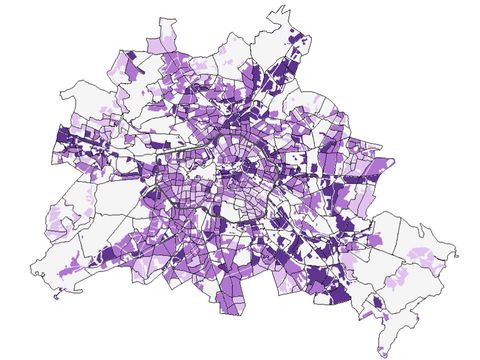
09.01.5 Social Disadvantage 2021/2022

Link to: 09.01.5 Social Disadvantage 2021/2022
Image: Umweltatlas Berlin

To determine the intensity of the burden associated with core indicator 5 of the Berlin approach to environmental justice, the distribution of social disadvantage was categorised into three levels for each planning area. The Social Urban Development Monitoring Berlin (MSS) provided the small-scale information required. More information

09.01.6 Integrated Multiple Burden – Environment 2021/2022

Link to: 09.01.6 Integrated Multiple Burden – Environment 2021/2022
Image: Umweltatlas Berlin

Multiple burdens, assessed by the four environmental core indicators air pollution, noise burden, thermal burden and green space supply, are highly concentrated in the inner city of Berlin, in contrast to the outer boroughs, where problems appear to be generally less severe. More information

09.01.7 Integrated Multiple Burden – Environment and Social Disadvantage 2021/2022

Link to: 09.01.7 Integrated Multiple Burden – Environment and Social Disadvantage 2021/2022
Image: Umweltatlas Berlin

The fifth core indicator ‘social disadvantage’ added to the four environmental core indicators air pollution, noise burden, thermal burden and green space supply illustrates the close link between the environmental and the social status. For example, areas with multiple environmental burdens exhibit a considerably higher proportion of low and very low index values. More information

09.01.9 Integrated Multiple Burden Map - Berlin Environmental Justice Map 2021/ 2022

Link to: 09.01.9 Integrated Multiple Burden Map - Berlin Environmental Justice Map 2021/ 2022
Image: Umweltatlas Berlin

Adding a vulnerability analysis (population density, quality of residential area) to the overall evaluation of all core indicators identifies those focal points at planning-area level that are particularly affected by burdens in combination with the population distribution. More information