Peatlands 2015

Methodology

Soil Types

Peat soils are in a category of their own in the classification of soils, since for no other soil the original material is formed together with the soil itself (Ad-hoc-AG Boden 2005). Thus a categorisation as peatland occurs if the soils consist of peats with more than 30 % by mass of organic substance and a thickness of at least 3 dm (including intercalated mineral layers and gyttja).

The map of the Soil Associations (SenStadtUm, Edition 2013a) with a scale of 1:50,000 does not represent the peat soils with sufficient spatial resolution and differentiation, since due to the conception and scale of the map peat soils are always combined into soil associations with other soil types. Due to the extensive terrain and laboratory records of the research project, Berlin’s peatlands can now be assessed better, and targeted adaptation strategies can be derived. A map of the soil types for the peatland sites was created at a scale of 1:5,000. In addition to the near-natural and drained peat soils, buried sites (e.g. construction waste deposits) and subhydric soils with high carbon content (e.g. sapropel) were also taken into account.

Within the research project, potential peatland areas were selected by intersecting the Geological Map of Prussia 1874 - 1937 (1:25,000, German only) and the Berlin Biotope Type Mapping (SenStadtUm, Edition 2012) - wetland biotopes - and were analysed and assessed according to the criteria of the German Soil Classification System (KA5, Ad-Hoc-AG Boden 2005). Recording peatland boundary points in the terrain and using the Digital Terrain Model (DGM1, Senatsverwaltung für Stadtentwicklung und Umwelt) allowed the peatland boundaries to be represented with high spatial resolution. The differentiation within the peatland areas is based on the polygons of the Biotope Type Mapping, on the assumption that identical biotope types represent similar soil properties of the topsoil (peat substrates, drainage depths). The location-related transfer of area-representative terrain profiles to the resulting peatland map was carried out using a geographic information system. A plausibility check was carried out; a manual correction was required only in few cases.

Carbon Stocks

In addition to the map that shows all Berlin peatland areas and their soil types (01.19.1), a further result of the research project is illustrated in the Environmental Atlas - the carbon stocks of the peatlands (01.19.2).

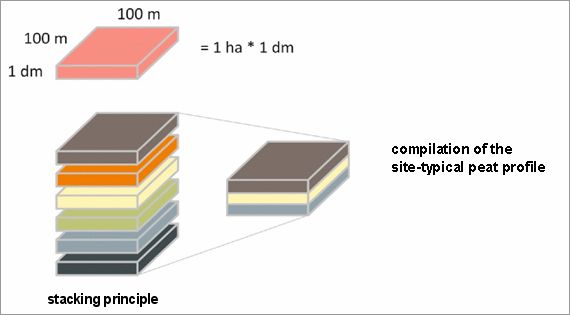
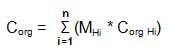
For assessing the carbon stocks, a ‘stacking system’ was put together from field and theoretical data, which covered 33 of the most prevalent soil horizons found in Berlin’s peatlands. The C storage quantities (Corg) per 1 ha land and 1 dm thickness were calculated for each of these horizons.

The stacking system allows the C storage quantities to be transferred to other peat soil horizons and soil profiles with similar soil and substrate properties (Figure 1). This allowed the C storage to be accurately determined for all of Berlin’s peatlands.

Fig. 1: Principle of the stacking system for the calculation of different C storages to assess climate pro-tection services

Fig. 1: Principle of the stacking system for the calculation of different C storages to assess climate pro-tection services

The present stacking system takes the typical features of the urban peatlands in Berlin into account. For instance, these have lower bulk densities than intensively used sites in rural areas.

The total C storage per hectare peatland Corg was determined using the following equation:

Formel

MH describes the corresponding horizon thicknesses in dm, while Corg H is for the amount of carbon stored per ha and dm thickness for each soil horizon i.

In calculating the carbon stocks, the C storage values of the abovementioned stacking system were converted from t/ha to kg/m2 by dividing by 10.

The amount of humus [kg/m2] was determined using the conversion factors according to Klingenfuß et al. (2014). According to soil type, the transition mires are multiplied by a factor of 2, the fens and sapropels by a factor of 1.8.

The classification of the results was based on the soil function assessment for Berlin (Gerstenberg 2013). However, in order to do justice to the diversity of the peatlands, the highest class of the soil function assessment was further subdivided and the categories “very high” and “extremely high” additionally defined.

Ecosystem services and fact sheets

In the research project “Berlin’s Peatlands and Climate Change”, meaningful indicators for assessing selected ecosystem services of the peatlands (climate protection services, habitat services, filtering functions, water retention services, cooling services) were developed as a basis for a three-level assessment system. The guiding principle or top criterion is the near-natural peatland ecosystem, which in regions with near-surface water levels is characterised by either new peat formation or peat preservation. The near-natural peatland has a variety of ecosystem services to offer, while peatlands that were drained or otherwise heavily affected by human influences cannot provide them, or can only do so at a much lower level. Important input information included our own soil data, the Berlin Biotope Type Mapping (scale 1:5,000) and peatland water levels (Berlin peatland monitoring), as well as the location, integration into the landscape and connectivity to open water bodies. The assessment of the ecosystem services is represented in the form of one bar chart per peatland area as part of the peatland area’s fact sheet.

Each fact sheet contains:

Name of the peatland,

Short description,

Protection status,

Ecological peatland type (primary),

Ecological peatland type (secondary, current),

Hydrogenetic peatland type,

Nature target,

Peatland area,

Peatland thickness (centre),

Soil (sub)types, dominant,

C storage [Corg] total, vulnerable, labile and vulnerable,

CO2 storage [CO2 equivalents] total, vulnerable, labile and vulnerable,

Assessment of the ecosystem services and a

Map with soil types and sampling locations.

Fact sheets for the 76 peatlands are available in both maps. The recording points of the fieldwork are also shown.

Recording points

The following information becomes visible via the data display of the recording points:

  • Name of the recording point,
  • Soil type according to KA5,
  • Recording date,
  • Profile depth [cm],
  • Number of recorded horizons,
  • Peat thickness (summary of the H horizons) [cm],
  • Peat thickness including overlying gyttja (summary of the H horizons) [cm],
  • Peat thickness including gyttja (summary of the H horizons) [cm],
  • Gyttja thickness [cm],
  • Drainage depth [cm].

Moreover, for every recording point the soil-scientific profile record can be displayed. This was exported from the soil-scientific Access database. The fact sheets of the peat substrates (Meier-Uhlherr et al. 2015; 307 MB) can be used to aid in interpreting the abbreviations used.