Depth to the Water Table 2006

Statistical Base

The depths to groundwater are calculated from the difference between the terrain elevation and the level of the potentiometric surface, or, in the case of confined conditions, the covering surface.

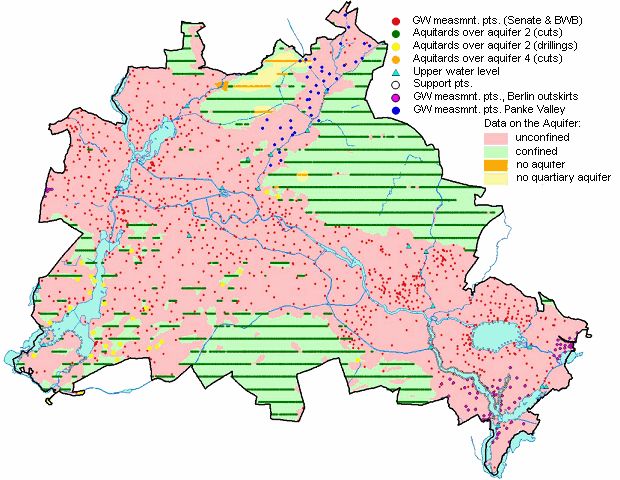
The ascertainment of groundwater levels is based on data taken from 1456 groundwater measurement sites (piezometers) of the Berlin State Groundwater Service, from water-supply companies and from the Brandenburg State Environmental Agency in May 2006.

Areas in Berlin with confined potentiometric surfaces were investigated using the digital information on hydrogeological sections of the Geological Atlas (SenStadt 2002) of Berlin, as well as selected bores (ultimate depth > 10 meters) from the drilling archives (cf. Fig. 6). At these measurement points, it was not the water levels, but rather the lower surfaces of the aquitards that were ascertained digitally.

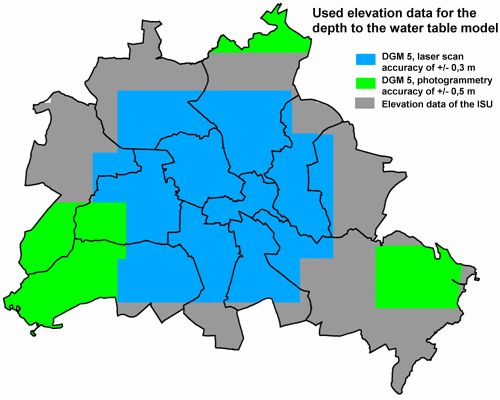
Compared to the edition 2007 the depth to the watertable of the existing map was calculated using a essential improved terrain elevation model. The terrain elevations were taken from a Digital Terrain Elevation Model based on different data bases with partly significant higher accuracies (cf. Fig. 5).

For approximately 70 % of the area the data from the Digital Terrain Elevation Model DGM5 with a grid size of 5 m and an accuracy of +/- 0.5 m were used. These data exist for big parts of the inner city, the south-west of Berlin and areas around the Müggel lake and were produced from data of laser scan flights and photogrammetry.

For other areas data from the dataset for the Digital Terrain Elevation Model of the Urban and Environmental Information System were used. These data were collected from calibrated points from different data sources. Because of the inhomogeneity of the database the errors are bigger in the unsettled regions than in the settled city centre, because of the interpolations for big areas, caused by the low point density. These data are altogether clearly more unexact than those from the DGM5.

The interpolation of the statistical base and the calculation into a common grid of 10 m was made with a calculation method (Surfer).

Fig. 5: Statistical base for the used elevation model

Fig. 5: Statistical base for the used elevation model

Moreover, numerous support points for water levels along the surface waters were included in the determination of the regional distribution of the potentiometric surface. These points were used only in areas undisturbed by water-utility activity. In Berlin, such locations are found exclusively in the outlying areas (e.g. along the Dahme of the upper Havel). The reason for the inclusion of these points is to avoid calculating groundwater levels above the table along these waters. Thus, even such small streams as the Große Kuhlake in the Spandau Forest or the Tegel or Neuenhagen Mill Streams (Erpe) were considered in this context.

The derivation of the two-dimensional information on groundwater confinement here described is based on the one hand on the existing invariant data on the spatial distribution of subsurface aquifers and aquitards, and on the other, on the data, which is variant in time, on the free top surface of the groundwater in areas without impeding surface layers for the near-surface groundwater. Since the level of the unconfined potentiometric surface can vary in these latter areas by several decimeters to a meter, depending on the intervals of comparison, it is also possible that there could be an area marked as “unconfined” in May 2002 which could prove to be “confined” in May 2006, and vice-versa.

For this reason, the above-mentioned analysis of the spatial distribution of groundwater confinement had to be checked with the aid of the information on the groundwater levels in May 2006, or repeated. The result is shown in Figure 6.

Fig. 6: Distribution of selected measurement information points for the investigation of the potentiometric surface

Fig. 6: Distribution of selected measurement information points for the investigation of the potentiometric surface

The differences in the results of the analysis for the two time periods are only slight, with 2% more confined areas state-wide. Some areas which were unconfined as of 2002 and shown as confined in 2006 can be seen in the area of the Barnim Plateau, and also of the Teltow Plateau in the south. The reverse case is recognizable on the western edge of the Panke Valley, where unconfined states have now been ascertained. This is however connected with a modification of the limits of the “Panke aquifer” in this area, which has changed the reference horizon.