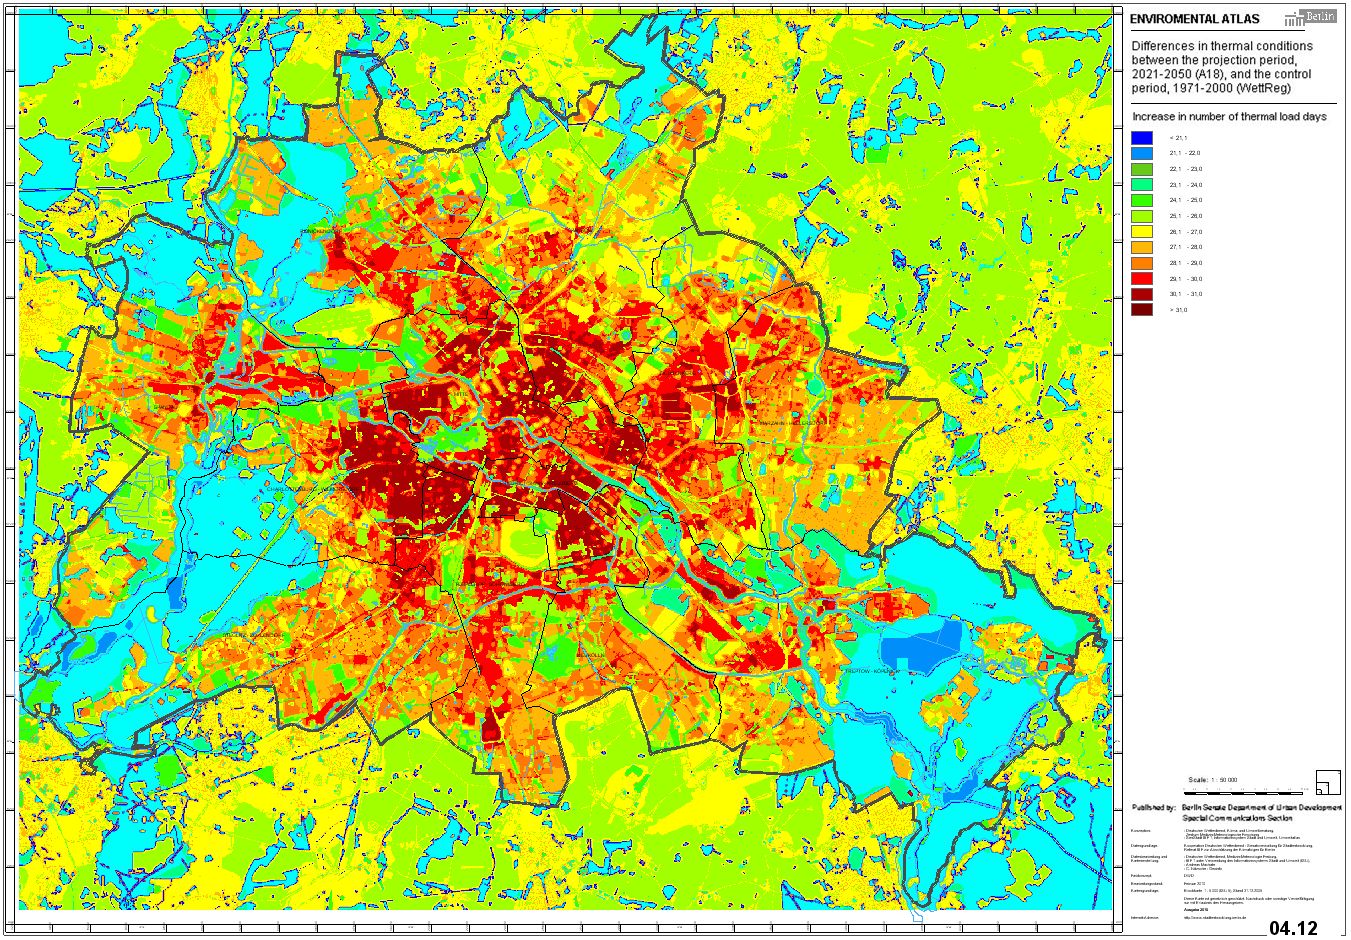
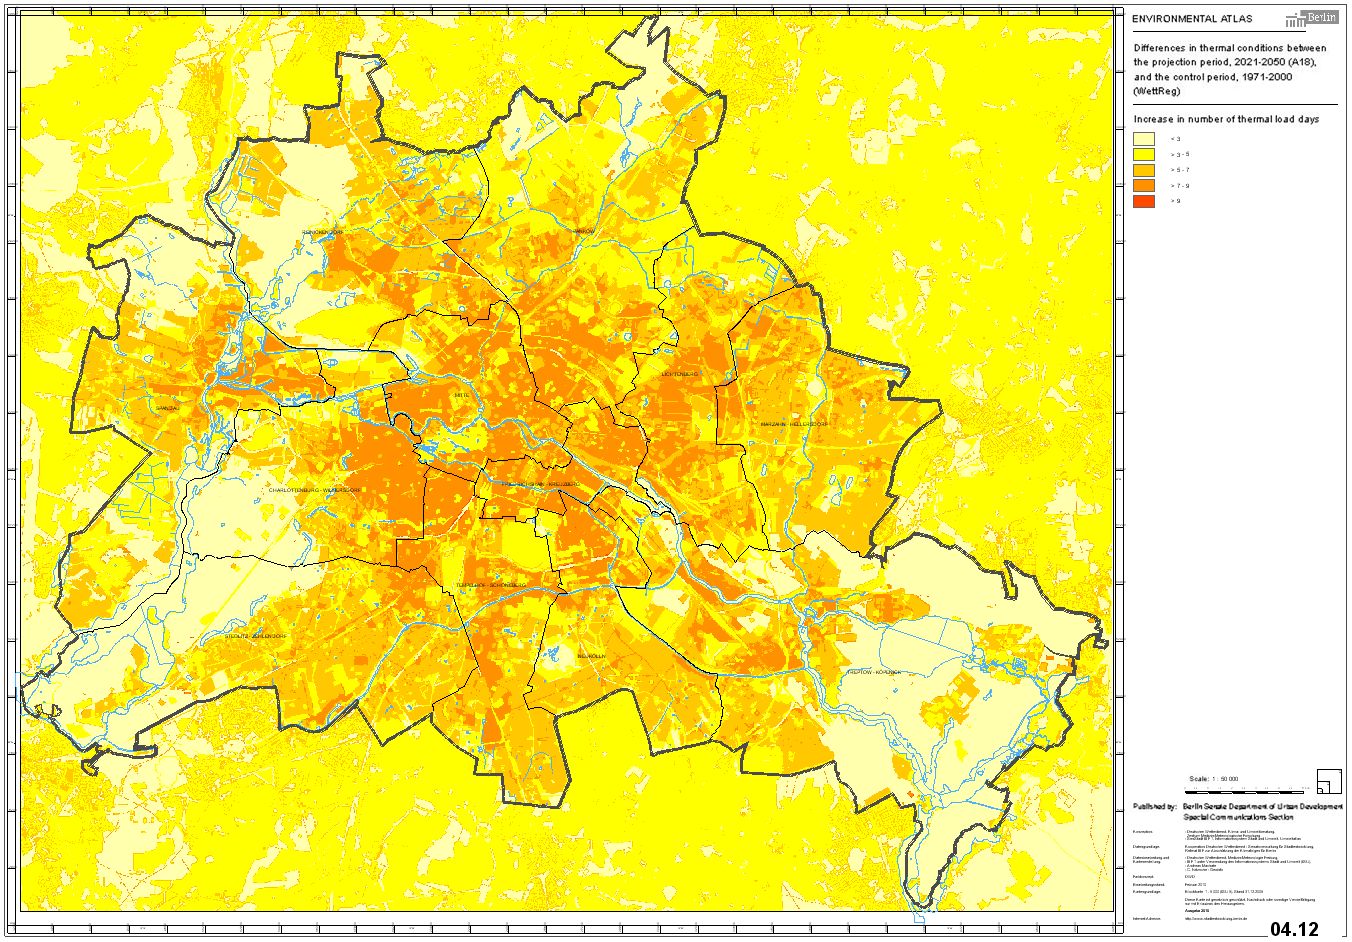
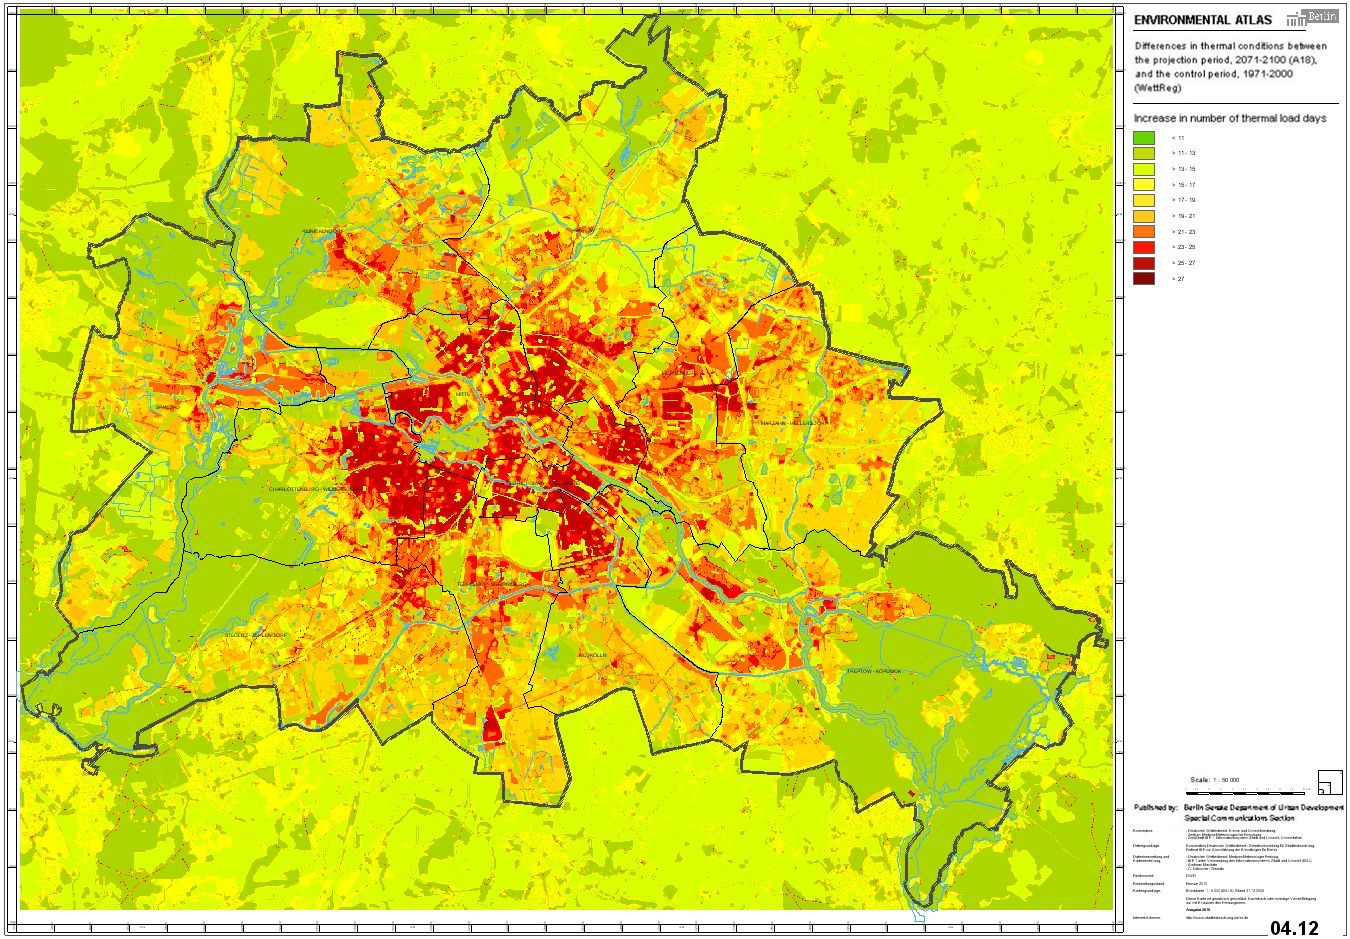
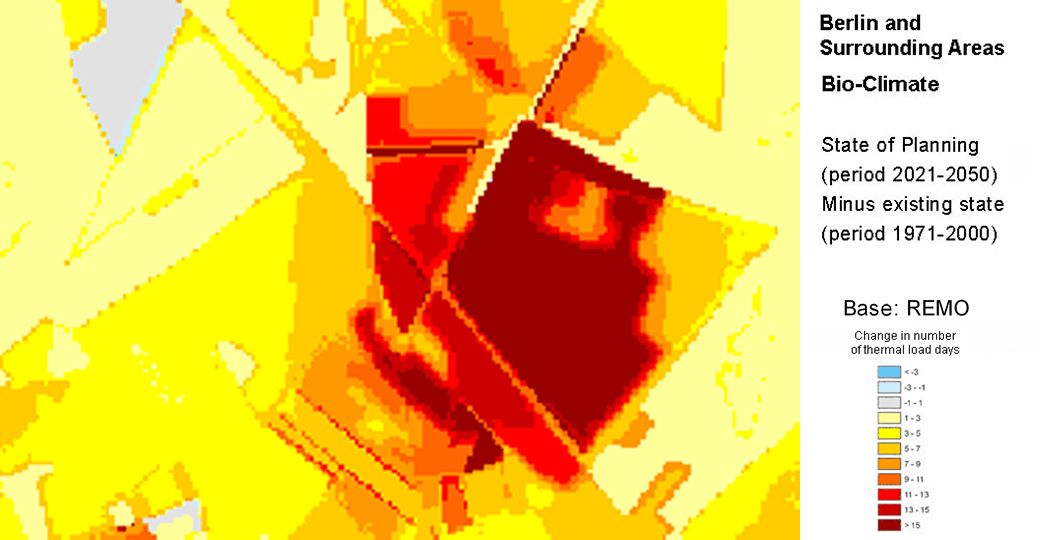
The combined bio-climate model was run with the values for background load and sunny day percentages from Tables 7 and 8. Based on an initial status quo of use distribution and factors of influence, such as soil sealing, extent of greening, etc., a case example is used to demonstrate how possible land use changes, which are to be expected over such a long observation period, could become a factor of additional impact.
Map 04.12.1 Annual Mean Number of Thermal Load Days for the 1971 – 2000 Period, for Berlin and the Surrounding Area /
Map 04.12.4 Total of Thermal Load Days for the 1971 – 2000 Period, for Berlin and the Surrounding Area
Using the real use data of the project area (see Statistical Base), the distribution of the Perceived Temperature as it would typically develop on the afternoon of a low-wind cloudless summer day was first calculated (Fig. 8).
The differences between the various uses and urban structures are clearly apparent. The increase in thermal load towards the densely built-up inner city is notable. The Großer Tiergarten, a central park area, stands out strikingly in the urban centre, however. There, a Perceived Temperature of approx. 5°C lower than in the inner city breaks up the structure of the thermal load. Often, in summer, the adjacent built-up area may already suffer under thermal load, but it is still possible to escape to cooler surroundings here. Other large open areas such as Britzer Garten, Südgelände or Treptower Park also fulfil comparable functions. On the other hand, the open space of the former inner-city airport at Tempelhof shows increased temperature values, due to lacking shade from trees and unhindered sunshine onto the meadow areas during the whole day; moreover, compared with normal parks, the area has a much reduced degree of cooling through evaporation.


