To calculate the green volume, the data sets of vegetation heights were intersected with the ISU5 areas (block, block segment areas and road areas) (intersections formed, cf. Figure 2) and the vegetation data was transferred to the ISU5 areas.
New
The Environmental Atlas maps are available in the new Map Application
Green Volume 2020
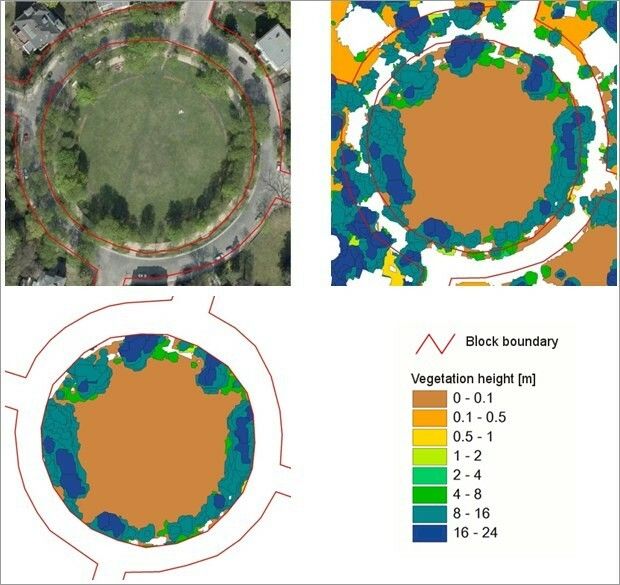
Fig. 2: Method for calculating the green volume of block (segment) areas (top left: orthophoto with block boundaries; top right: vegetation areas with block boundaries; bottom: trimmed vegetation areas and legend)
Image: Umweltatlas Berlin
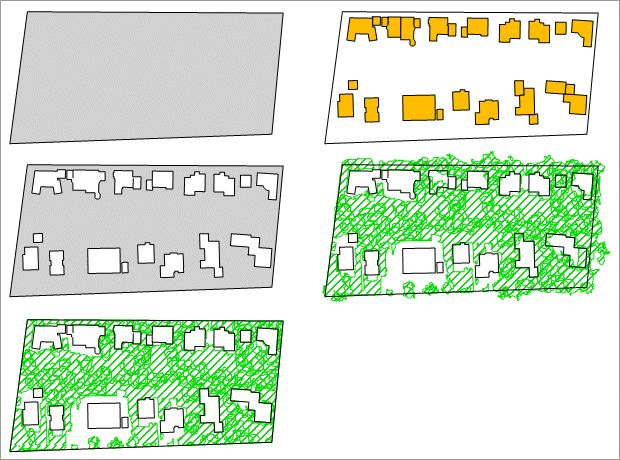
Fig. 3: Method to calculate the green volume of non-built-up block (segment) areas (top left: block area; top right: buildings above ground; centre left: non-built-up block area (grey share); centre right: vegetation cover; bottom: vegetation of the non-built-up block area)
Image: Umweltatlas Berlin
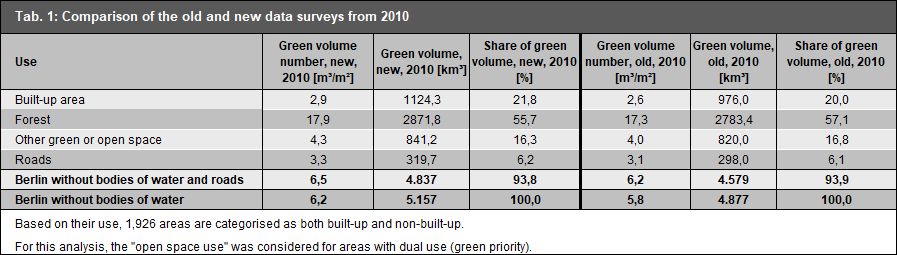
Tab. 1: Dataset from 2010: comparison of the old and new data surveys
Image: Umweltatlas Berlin
Environmental Atlas Contact
Berlin Senate Department for Urban Development, Building and Housing
Mr. Hartbecke