The Environmental Atlas maps are available in the new Map Application
Long-term Development of Selected Climate Parameters 2013
Berlin-Dahlem
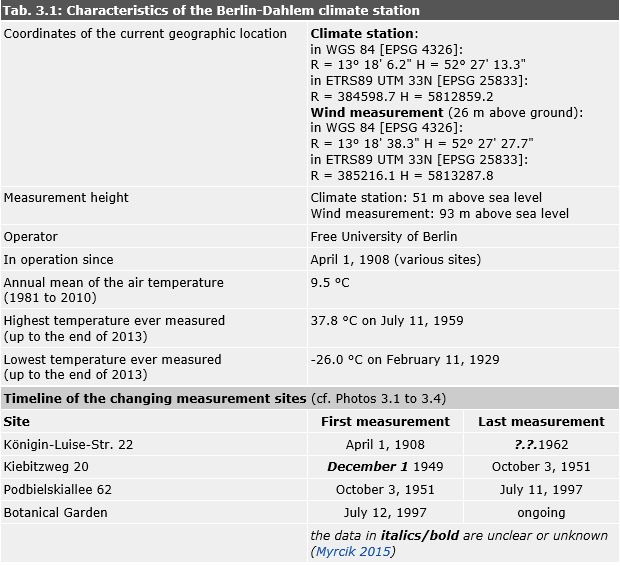
Tab. 3.1: Characteristics of the Berlin-Dahlem climate station
Image: Umweltatlas Berlin
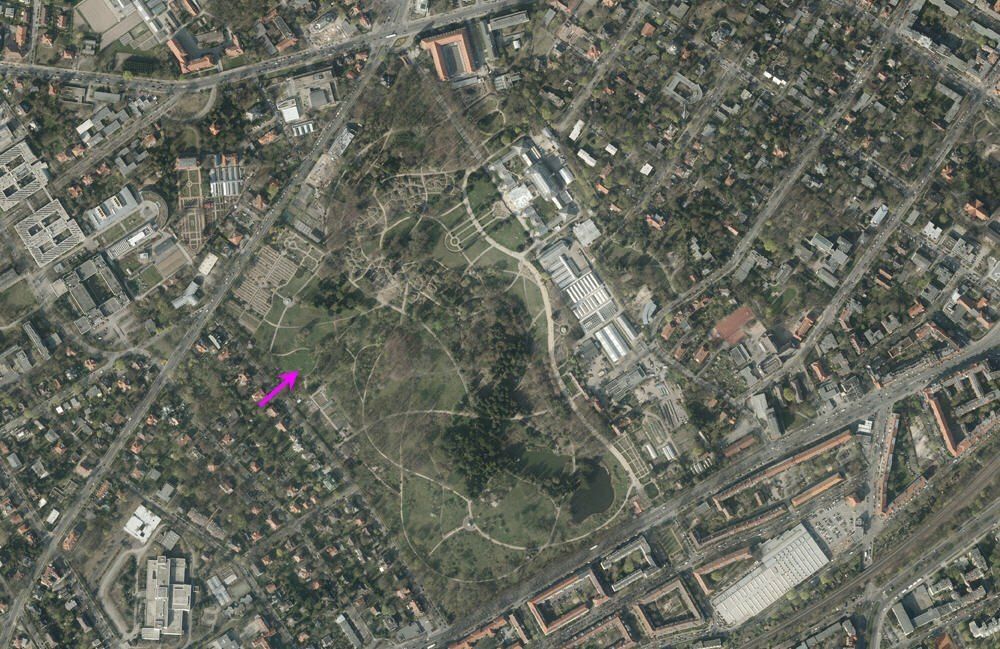
Photo 3.1: Location of the Berlin-Dahlem station (see arrow mark)
Image: SenStadtUm 2014
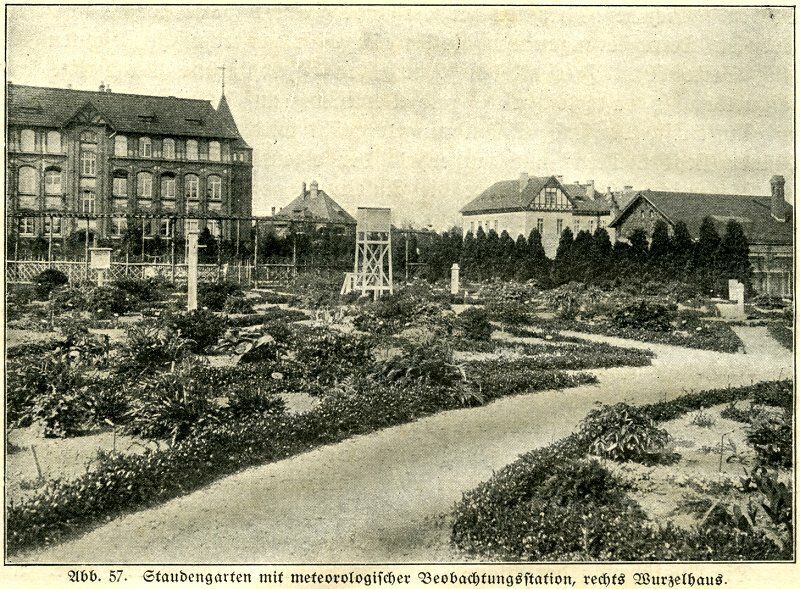
Photo 3.2: Site of the Dahlem climate station on the grounds of the Royal Gardening Academy (Königliche Gärtnerlehranstalt) at Königin-Luise-Str. 22 (period from April 1, 1908 to 1962)
Image: Archive Institute of Meteorology (FU Berlin)
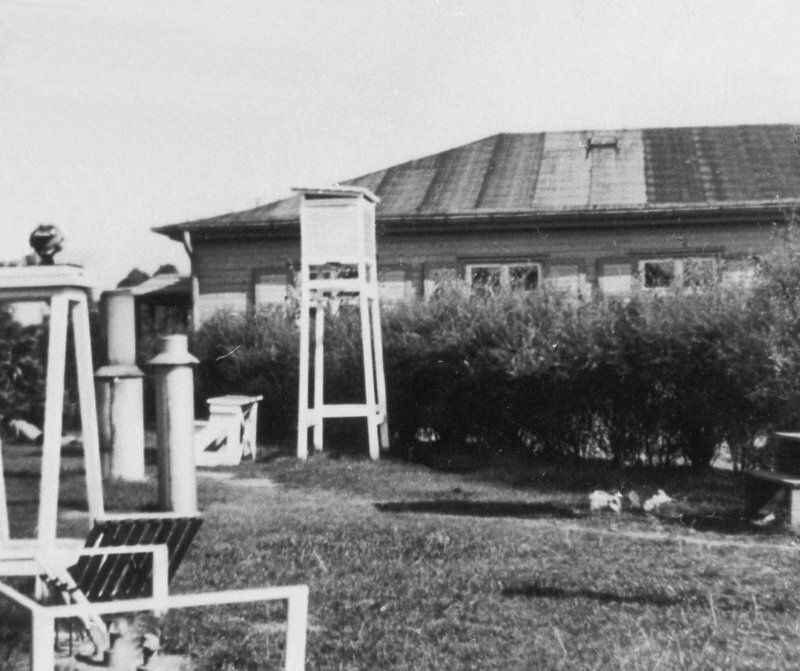
Photo 3.3: Site of the Dahlem climate station on the grounds of the first site of the Institute of Meteorology of the FU Berlin at Kibitzweg 20 (period from December 1 (uncertain) 1949 to October 2, 1951)
Image: Archive Institute of Meteorology (FU Berlin)
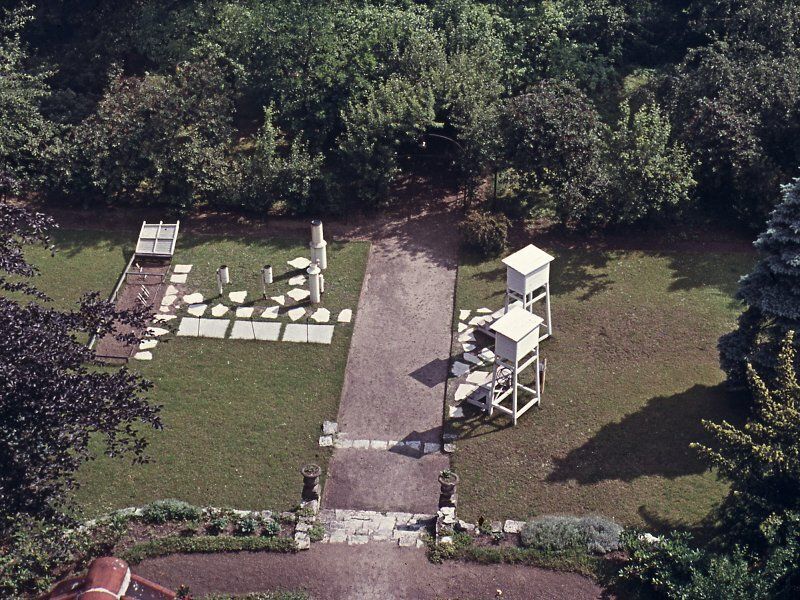
Photo 3.4: Site of the Dahlem climate station on the grounds of the second site of the Institute of Meteorology of the FU Berlin at Podbielskiallee 62 (period from October 3, 1951 to July 11, 1997)
Image: Archive Institute of Meteorology (FU Berlin)
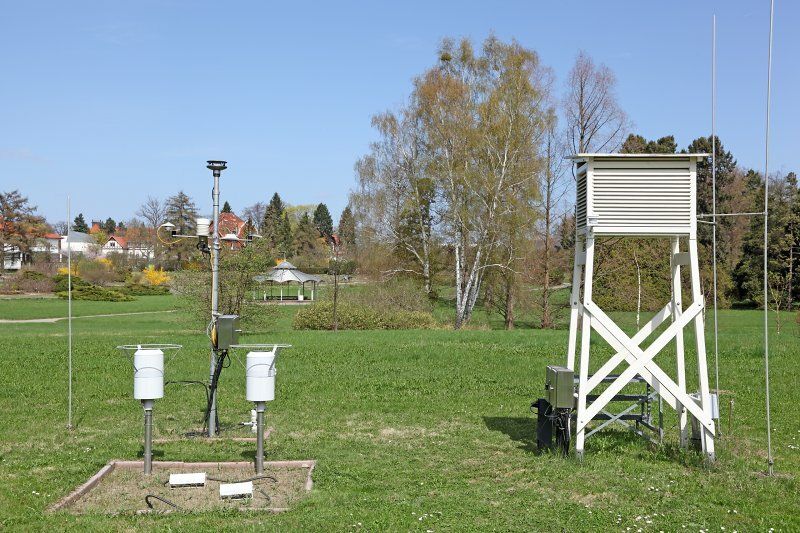
Photo 3.5: Current site of the Dahlem climate station on the grounds of the Berlin Botanical Garden at Königin-Luise-Str. 6-8 (period since July 12, 1997)
Image: Georg Myrcik
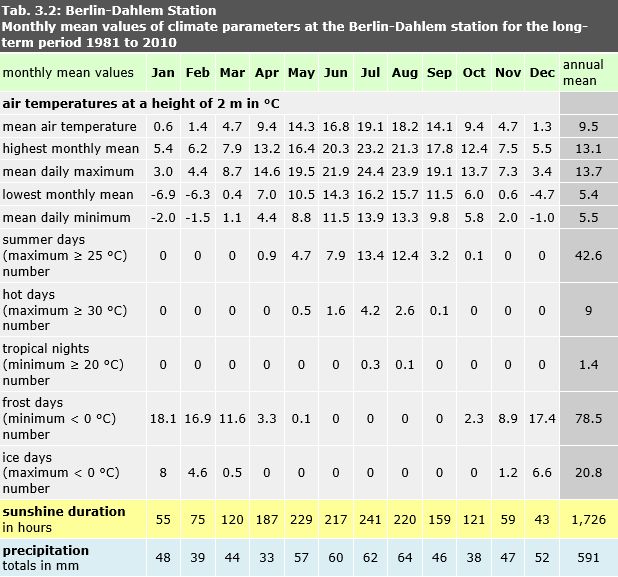
Tab. 3.2: Monthly mean values of climate parameters at the Berlin-Dahlem station for the long-term period 1981 to 2010
Image: statistical base DWD, processing GEO-NET 2014
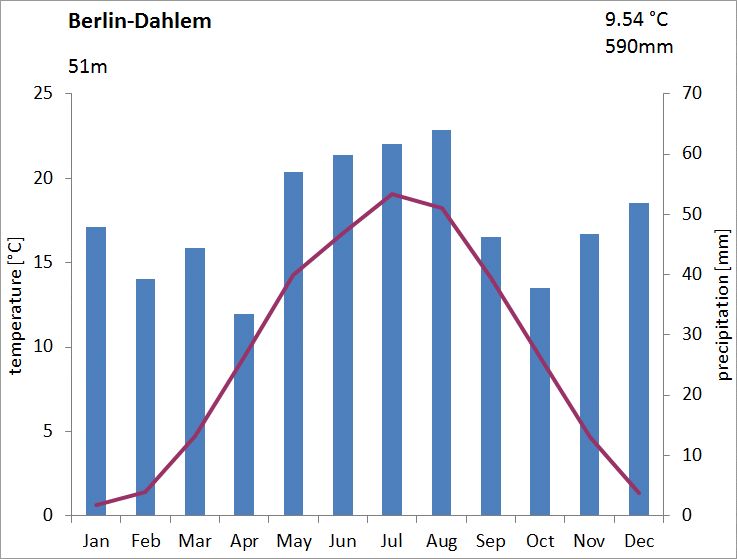
Fig. 3.1: Climate diagram of the Berlin-Dahlem station for the long-term period 1981 to 2010
Image: GEO-NET 2014, Knerr 2014
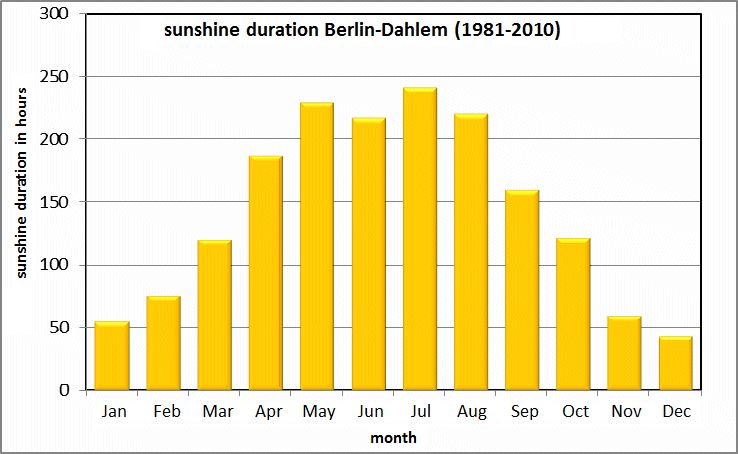
Fig. 3.2: Mean monthly sunshine duration at the Berlin-Dahlem station for the long-term period 1981 to 2010
Image: statistical base DWD, processing GEO-NET 2014
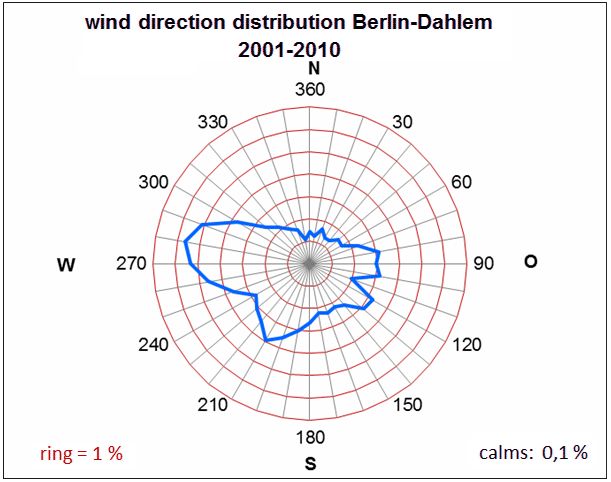
Fig. 3.3: Mean wind direction distribution in the period 2001 to 2010 at the Berlin-Dahlem measurement station (measurement height 26 m). The ring lines indicate the frequencies of occurrence of the wind directions, their distance corresponds to 1 %
Image: statistical base DWD, processing GEO-NET 2014
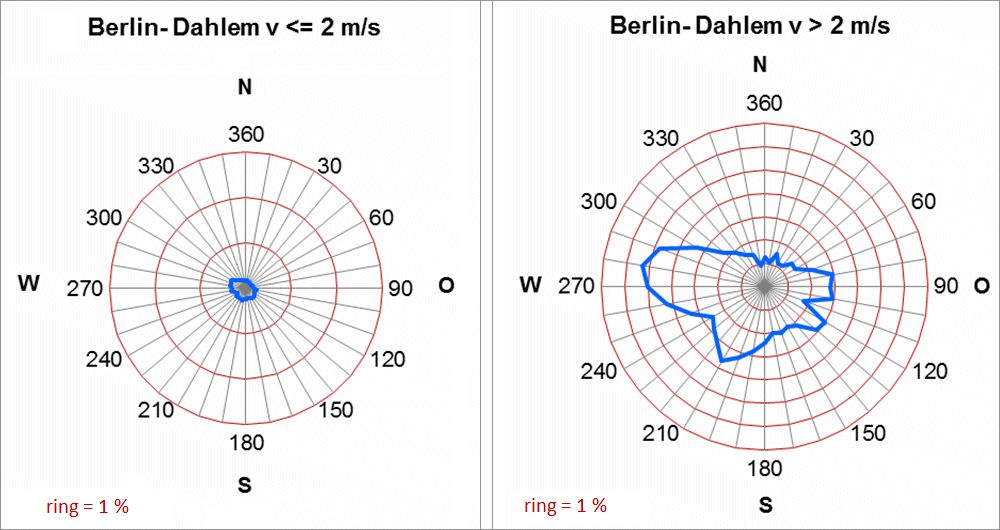
Fig. 3.4: Frequencies of the wind directions in the annual mean at the Berlin-Dahlem measurement station in the period 2001 to 2010 by wind speed
Image: statistical base DWD, processing GEO-NET 2014
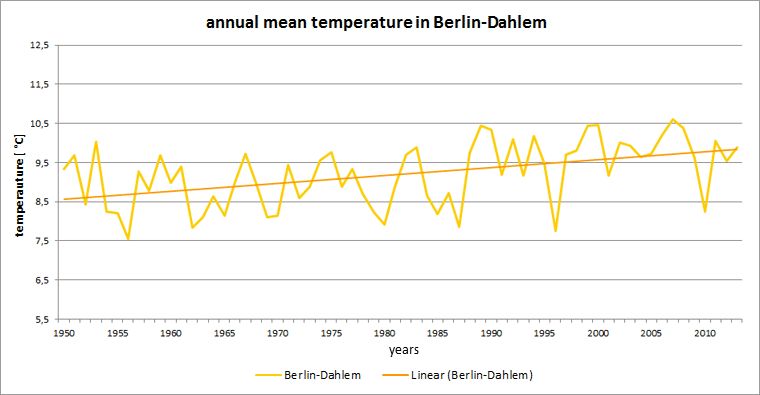
Fig. 3.5: History of the annual mean temperature at the Berlin-Dahlem station in the period 1950 to 2013
Image: GEO-NET 2014, Knerr 2014
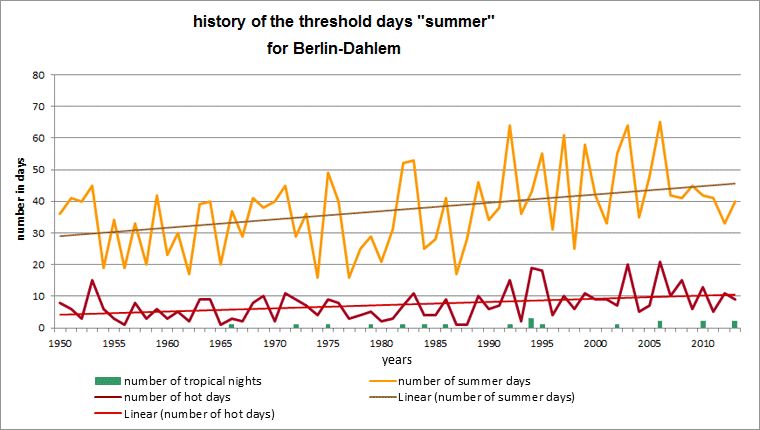
Fig. 3.6: History of the threshold days summer day, hot day and tropical night at the Berlin-Dahlem station in the period 1950 to 2013
Image: GEO-NET 2014, Knerr 2014
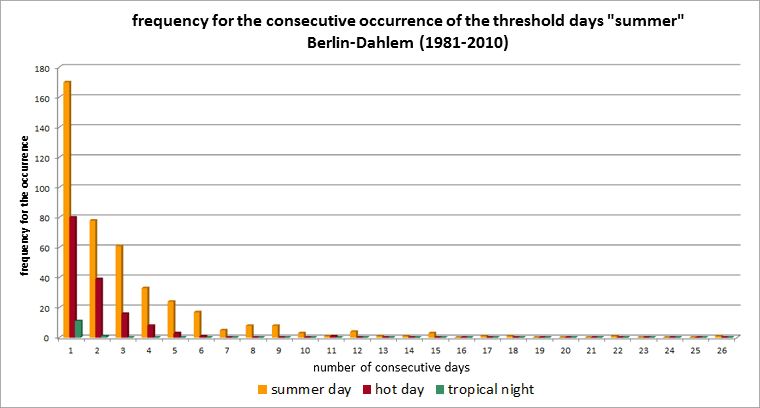
Fig. 3.7: Frequency of occurrence of consecutive summer days, hot days and tropical nights for the long-term period 1981 to 2010 at the Berlin-Dahlem station
Image: GEO-NET 2014, Knerr 2014
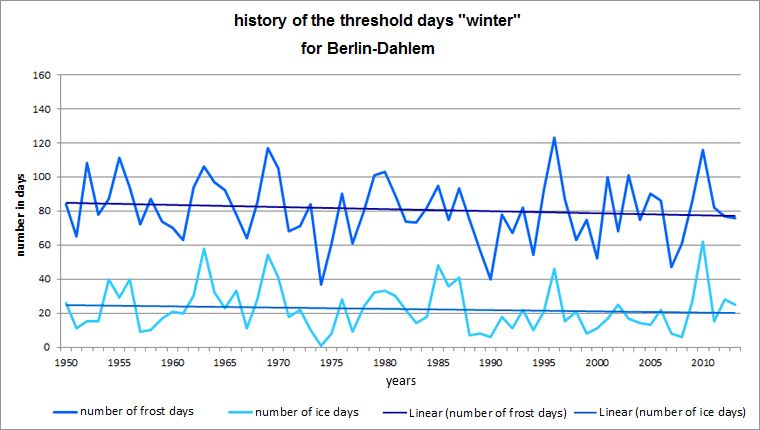
Fig. 3.8: History of the threshold days frost day and ice day at the Berlin-Dahlem station in the period 1950 to 2013
Image: GEO-NET 2014, Knerr 2014
Environmental Atlas Contact
Berlin Senate Department for Urban Development, Building and Housing
Mrs. Haag