Environmental Justice Berlin 2021/2022

Statistical Base

Berlin has comprehensive datasets for the areas of the environment, health, social affairs and the city (urban development). Generally, each of these is subject to topic-specific monitoring and publication, often required by law. The different areas are, to a large extent, thus reported on independently of each other, i.e. without any overlaps. The merging of different datasets due to the varying methodological approaches, diverging survey intervals and varying levels of detail poses a great methodological challenge.

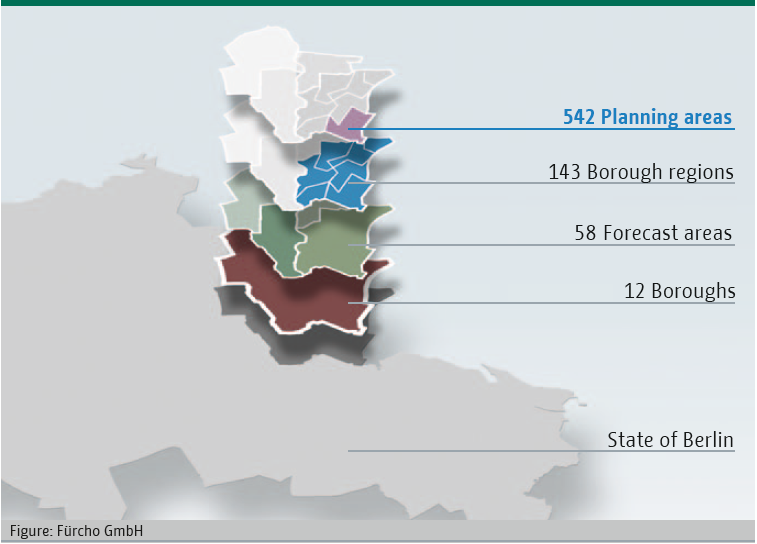
In contrast to individual in-depth analyses, the Berlin environmental justice approach seeks to provide a comprehensive overview of the situation as a whole, by analysing data available for different sectors and aggregating this data on a small scale. This small-scale level is based on the planning areas (PLA). With 542 areas, it is the most detailed of the three levels associated with the system of the living environment areas (LEA) in Berlin (as of January 1, 2021, cf. Fig. 1 and SenStadtWohn 2020). The planning areas are primarily used for city-wide monitoring, for example of the development of the housing market, environmental justice and social urban development. For Berlin as a whole, the average number of inhabitants per PLA is around 6,970 (as of December 31, 2018).

Fig. 1: The three-level classification of the Living Environment Areas (LEA) in Berlin

Fig. 1: The three-level classification of the Living Environment Areas (LEA) in Berlin

In addition to the following geospatial basis:

  • Living Environment Areas (LEA), geospatial hierarchy “Planning Areas” (PLA), as of January 1, 2021

The following data bases were used for the 5 core indicators investigated:

  • Core indicator noise burden: Strategic Noise Maps 2017, including recalculations of important noise reductions due to the closure of Tegel Airport effective from May 4, 2021, Senate Department for the Environment, Urban Mobility, Consumer Protection and Climate Action
  • Core indicator air pollution: data from NO2 measuring stations from 2019 and PM2,5 modelled data from 2018, Senate Department for the Environment, Transport and Climate Protection
  • Core indicator thermal burden: Climate Model Berlin, 2015 (Environmental Atlas), Map Evaluation Index of Physiological Equivalent Temperature (PET) and Map Distribution of Air Temperature, Senate Department for Urban Development and Housing
  • Core indicator green space supply: “Analysis of the urban availability of green space (VAG)”, 2020, Senate Department for the Environment, Transport and Climate Protection
  • Core indicator social disadvantage: Social Urban Development Monitoring, 2021 (MSS), Senate Department for Urban Development, Building and Housing
  • Berlin Environmental Justice Map: additional information
    • on simple residential area: Rent Index, 2021, Senate Department for Urban Development and Housing
    • on population density on December 31, 2021, Statistical Office for Berlin-Brandenburg.

The final illustration includes a layer of “predominantly uninhabited areas” that is superimposed on the spatial reference system of the PLA. The maps therefore focus on inhabited residential areas. “The category of “predominantly uninhabited areas” groups together outdoor uses (forest, water, agriculture), expansive green spaces, and non-residential building uses (commercial and industrial, traffic facilities, technical infrastructure)” (translated from SenSW 2019, p. 78).