Green Roofs 2020

Change Analysis

The total area of green roofs increased by 165 ha between 2016 and 2020. The share of green roof areas therefore rose from 3.0 to 3.2 %. Almost half (approx. 75 ha) of the new green roof areas were added to buildings with residential use. This is reflected in the results of the area type analysis (cf. Tab. 3). About 53 ha of roofs were newly greened in the area type “Settlement from the 1990s and later”. Another 17 ha of green roof area were created in the area type “Closed block development, rear courtyard, 5-6 storeys”, which is mostly found in the inner city boroughs. The building types “Non-residential buildings and “Office buildings, commercial” received almost 40 ha of rooftop greenery, while it was about 28 ha for “Underground car parks without superstructures”.

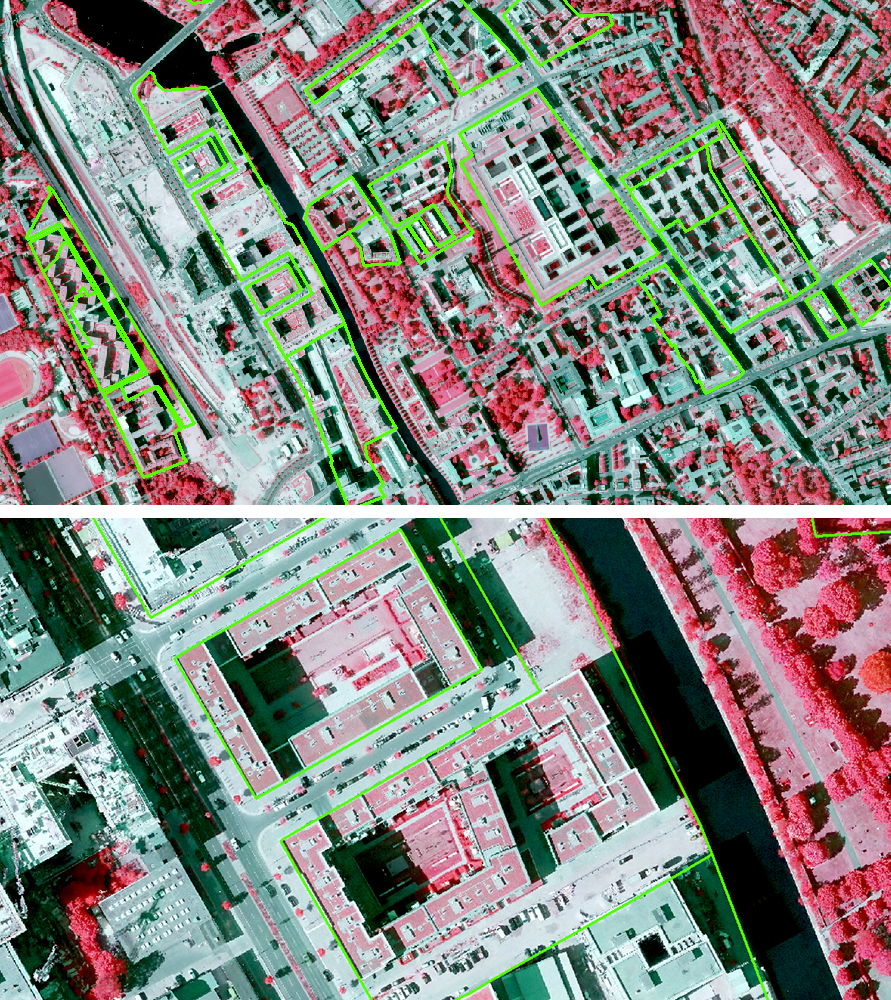
An initial analysis at the borough level indicates that both the share of the number of buildings with green roofs in relation to the total number of buildings and the share of green roofs in relation to the floor area of the buildings increased across all boroughs. A differentiated analysis reveals that roof shapes suitable for greening are more likely to be found in the inner city boroughs, as are new green roofs. In the boroughs of Mitte and Friedrichshain-Kreuzberg, the number of green roofs in the total number of buildings increased by 2 and 3 % respectively. The green roof area in the borough of Treptow-Köpenick increased by about 20 ha, which is also remarkable (cf. Fig. 4). Here, a lot of new residential and commercial buildings with green roofs were built in the area of Adlershof.

The ‘change mapping’ below illustrates how the green roof area (in %) has changed in relation to the block (segment) area and how it is distributed across the city.

Fig. 7: Change mapping of the green roof area share in the block (segment) area [%] between 2016 and 2020

Overall, 86 block (segment) areas with a decreased green roof area share of more than 2 % are offset by 1,258 block (segment) areas with an increased green roof area share of more than 2 %. Europacity, north of the Hauptbahnhof (Berlin Central Station), has a strong concentration of block (segment) areas with new green roofs.

Fig. 8: Example of Europacity: new development with green roofs, 2020

Fig. 8: Example of Europacity: new development with green roofs, 2020

h5. Top: green: block (segment) areas with an increased green roof area share > 5 %;
Bottom: section of new development with green roofs; background: TrueOrthophoto, 2020

A new cluster of buildings with green roofs was also erected in the ‘Science City’ of Adlershof (borough of Treptow-Köpenick). These include commercially used buildings in the Science and Technology Park, university buildings on campus as well as modern apartment buildings.

An example of the removal of a green roof may be found in block 1200620771000000, at the corner of Schloßstraße/ Albrechtstraße. Here, a green roof was removed from the low part of a building and replaced by a storage area.

Fig. 9: Example of the removal of a green roof on Schloßstraße

h5. Yellow: green roof area, blue: block (segment) area, black: building
Left: 2016 mapping, right: 2020 mapping

In 2016, Digitale Dienste Berlin, Büro für Angewandte Fernerkundung, und Luftbild Umwelt Planung GmbH (office for applied remote sensing) developed a method for recording green roofs in Berlin. It was used again successfully to update the data in 2020. The method facilitates a homogeneous, up-to-date city-wide recording of green roofs with sufficient accuracy. It is both operational and cost-effective. The use of TrueOrthophotos made it possible to improve the mapping accuracy compared to the recording of 2016. The tilting of buildings could thus be minimised. In contrast to the 2016 mapping, aerial images taken in the middle of summer were used. In addition, the vitality of the vegetation decreases in the summer, due to mounting stress of drought. Extensive green roof areas with sparse vegetation, which were still recognised as green roofs in 2016, might not have been recorded in 2020 as a result. Furthermore, due to the change in season between the 2016 and 2020 aerial photographs, there are phenological differences that reduce the comparability of the two mappings. This applies in particular to canopy covers of large deciduous trees.