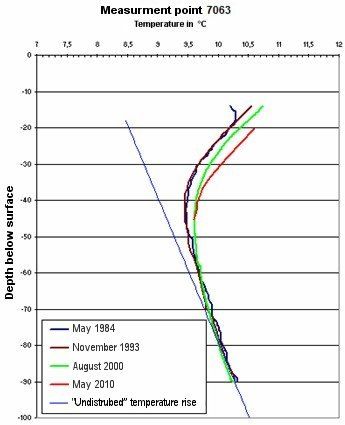
The measured temperature profiles taken in 1984 and 1993 show approximately the same temperature progression for the neutral zone in approx. 18 m of depth and for the deeper subsoil at greater than 20 m depth. A comparison with the assumed "undisturbed" temperature progression shows a considerable increase in the underground temperature up to approx. 70 m depth. At 40 m depth, this temperature difference is still approx. 0.5 °K. This temperature increase, which was ascertainable until the beginning of the 1990s, can presumably be attributed to changes in the local climate caused by the construction of a large housing estate in the immediate proximity during the 1960 and 1970s.
An additional temperature rise of approx. 0.4 °K could be observed in the neutral zone between 1993 and 2010; it can currently be ascertained to depths of approx. 40 m. Since in this case, there were no significant changes, such as construction, in the area around the measurement point during this time period, which could have caused changes in the local climate, there is presumably a connection with the effects of general climate warming. During the same time period, the mean air temperature in 2 m height measured at the secular station in Potsdam has increased by approx. 0.5 °K (Henning Energie- und Umweltberatung 2010).
Groundwater Temperature Distribution Map for the Reference Horizon 20 m Below Surface
In the present map, the groundwater temperature distribution at the reference horizon area 20 m below surface in the area of the so-called neutral zone for the State of Berlin is shown. Generally, no effect of seasonal temperature fluctuations is ascertainable at such depths. The distance between the isolines is 1 °C.
The groundwater temperatures fluctuates between < 8.5°C in the outskirts and > 12.5°C in the densely built-up inner city area and in the industrial areas. Generally, a tendency towards higher temperatures from the outskirts to the city centre can be observed. The temperature progression shows a continuous increase from the northeast toward the city centre, while in the other areas of the city, the appearance of several smaller positive and negative temperature anomalies is characteristic.
The densely built-up city centre with its highly impervious surface is enclosed by a 11.5 °C isoline. The heat island with temperatures of more than 12.5 °C which is apparent in the city centre, is interrupted by the Great Tiergarten, a large green space in the centre of the city. Within this heat island, isolated anomalies with temperatures above 13.0 °C can be observed, as local examinations have shown. The highest temperatures have been measured near cooling water inflows near heating and power stations.
Outside of the city centre, too, positive temperature anomalies correlate with highly impervious areas (cf. Map 01.02, SenStadt 2007), such as secondary centres and industrial areas.
Below the extensive woodlands on the outskirts to the southeast, the north, the northwest and the southwest, the temperatures are in the area of 9 °C or less. Negative temperature anomalies of less than 10 °C in the municipal area correlate with areas characterized by a high proportion of vegetation, e.g. the Britz Gardens.
Groundwater temperatures in the densely populated inner urban area are generally more than 4°C higher than in the open countryside.
Groundwater Temperature Distribution Map for the Reference Horizon 0 m Above Sea Level
The second map shows groundwater temperature distribution for the reference horizon 0 m above sea level in the State of Berlin. This corresponds top edge to a depth between approx. 30 to max. approx. 70 m into dependence of the situation in the glacial valley or on the high areas under area (cf. Fig. 3). In these depths an influence of the daily and seasonal temperature fluctuations is excluded. In these depths continuous temperature variations which e.g. are caused by a changed structural development or climatic changes can, however, manifest themselves in the long run.
The distance between the individual isolines is 1 °C on this map. A direct comparison of this map with the 1999 Edition is not possible, due to the different data basis with regard to the measurement point density, and because a less precise temperature gradation has now been chosen.
On this map too, groundwater temperatures fluctuate between < 8.5 °C in the outskirts and > 11.5 > °C in the densely built-up inner city area.
In the densely built-up and highly impervious city centre, the area enclosed by a 11.5 °C isoline (depth position approx. 30 m below surface) has been considerably reduced. On the other hand, there has been a considerable enlargement of the areas in the temperature range between 8.5 and 9.5 °C, which is to some extent due to the depth position of the reference horizon (between > 30 m and < 70 m). This is particularly true of the south-eastern, northern and north-western outskirts areas.
A comparison with the groundwater temperature distribution map for the 20 m reference horizon under area top edge shows that particularly the smaller positive and negative temperature anomalies be watched in the southern and south-eastern municipal area do not appear any more.
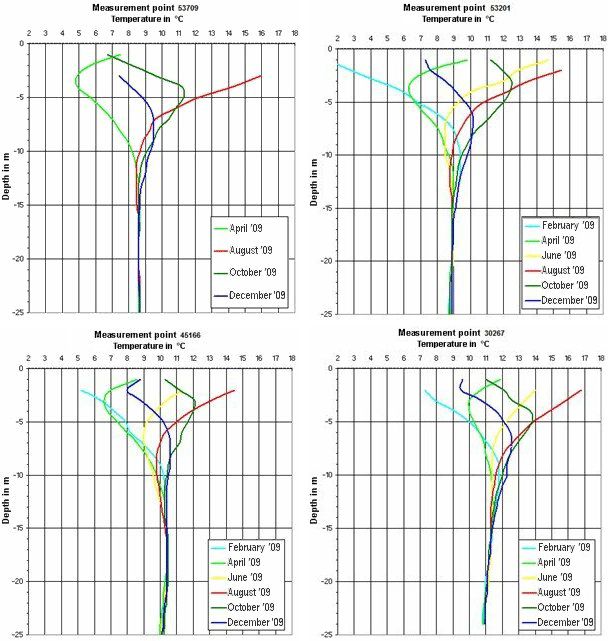
In summary, it can be ascertained that groundwater temperature increases in the densely populated inner city area of more than 4 °C compared with the open countryside can occur, which is thus a considerable degree of warming. There is a clear connection with urban climatic conditions at the surface. The results of regular investigations at selected temperature measurement points in locations of varying urban structures also confirm this.
Overall, the near-surface groundwater temperature distribution in the State of Berlin generally shows a connection with the distribution of industrial facilities, waste heat producers, impervious surfaces, open spaces and surface waters warmed due to anthropogenic activity (see also Henning1990). Taking the groundwater flow field into consideration, it can be assumed that these factors have a substantial influence on the change in groundwater temperature. Since there is generally an accumulation of such factors in the city, these factors are mutually reinforcing (Blobelt 1999).
On basis of data from long-term investigations, it can be shown that due to progressive structural development and also to general climate change, a further very considerable warming of the near-surface (< 20 m depth) and deeper (to 100 m depth) subsoil, and hence also of the groundwater, can be assumed.