New Groundwater Formation 1990

Map Description

In the areas with open aquifers, new groundwater formation rates correspond to the percolation rates represented in Map 02.13.2. The new groundwater formation rates shown in the map are lower than the percolation water rates in the areas with covered aquifers, depending on the conditions and the reduction factors ascertained. In the areas with covered aquifers, a reduction of at least 18 % (Wuhle) and at most 76 % (Tegel Creek) over the percolation water rates occurs; in most areas with covered aquifers, the new groundwater formation rate is approx. 40 % – 50 % below the percolation water rate.

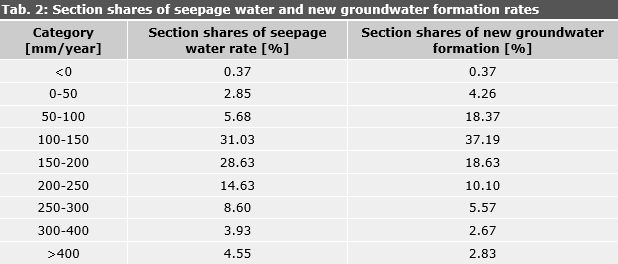
The area shares of the different percolation water rates according to Map 02.13.2 and the derived new groundwater formation rates (Map 02.17) are shown in Tab. 2. The category with 100-150 mm/yr. predominates. Due to the reduction in the covered areas, a shift from higher too lower values occurs in the new groundwater formation values, as compared with the percolation water rate, which is primarily evident in the mean values. Thus, the section shares of the category 50 – 100 mm account for 5.68 % of the percolation water rate, but for only 18.37 % the new groundwater formation rate. On the other hand, the section shares for percolation water rates of the categories above 150 mm are consistently greater than for new groundwater formation rates.

Tab. 2: Section shares of percolation water and new groundwater formation rates

Tab. 2: Section shares of percolation water and new groundwater formation rates

From the new groundwater formation rates, the totals for the area of the State of Berlin can be derived, with consideration for section sizes. In Tab. 3, these values have been juxtaposed to the corresponding values for total runoff formation and percolation water formation:

Tab. 3: Water balance and new groundwater formation in Berlin

Tab. 3: Water balance and new groundwater formation in Berlin

h5. Remarks:
1. All values exclusive of bodies of water. Shore filtrate shares (which e.g. are discharged in the Berlin waterworks from the Havel and Spree) are not taken into account in percolation water formation or new groundwater formation.
2. Information on total runoff and percolation water formation diverge from data in Tab. 3, map 02.13. This is due on the one hand to the fact that in Tab. 3 of map 02.13 section-weighted mean values were formed, and on the other hand the depth to groundwater of May 2002 was used for the calculation, which to some extent affects the values.

It has to be taken into account that the calculations for percolation water rates were carried out with consideration for sealing. This means that the stated values for new groundwater formation give mean values covering sealed and unsealed areas of the block sections represented. Since the sealing and the different availability of sewers affect the water balance considerably, the stated values are not transferable to the unsealed areas of the respective sections. For this reason a calculation assuming completely unsealed conditions was also carried out, for the sake of further-reaching planning purposes. These data are also available at the Senate Department, but have not been published in the Environmental Atlas.