Traffic Volumes ADT 1993

Methodology

Fluctuation in Motor-vehicle Traffic

Traffic counts occur on freeways and federal highways nationwide at the behest of the Federal Minister of Traffic, according to a uniform method and for comparable periods. They are undertaken by the respective state authorities, in Brandenburg by the Brandenburg State Office for Traffic and Road Construction, in Berlin by the Department of Traffic and Utilities, which is also responsible for the supplemental elevations in the remaining major street network.

As stated above, the seasonal, weekly and daily fluctuation in motor-vehicle traffic are of essential significance for the evaluation and projection of traffic counts. Thus, for example, in the winter months (January, February), at the sudden onset of winter (end of November and December), as well as in the summer vacation (July), the traffic volume recedes significantly (cf. Fig. 3).

Fig. 3: Annual Progress Line of the Daily Traffic Levels at the Halensee Long-term Measurement Point on Freeway A 100, 1993

Fig. 3: Annual Progress Line of the Daily Traffic Levels at the Halensee Long-term Measurement Point on Freeway A 100, 1993

The traffic levels are also subject to fluctuation within the week, which depends on the respective weekday. The most constant traffic conditions in motor vehicle traffic are encountered Mondays through Thursdays.

Fig. 4: Average Hourly Traffic Levels per Weekday in 1994, at the South Reinickendorf Long-term Measurement Point, Freeway A 111

Fig. 4: Average Hourly Traffic Levels per Weekday in 1994, at the South Reinickendorf Long-term Measurement Point, Freeway A 111

The patterns of the day-time progress lines of these workdays is almost identical. Clearly visible in Figure 4 are the morning and afternoon commuting peaks for the workdays. The Friday progress line likewise proceeds analogously to the remaining workdays for the morning peak, while the afternoon peak appears about 2 hours earlier. The progress lines for truck traffic shows a bell-like pattern. They are approximately congruent Mondays through Thursdays, and reach peak levels usually between 9 AM and 12 noon. Here, too, as with private motor vehicles, afternoon traffic on Friday starts about two hours earlier than on the remaining workdays. On weekends, truck traffic is of only slight significance.

Daily Fluctuation of Traffic Volumes

The daily fluctuation can be elucidated exemplarily by the day-time progress lines of a distance within the center of town, and of a distance leading radially to the center of town (cf. Fig. 5 and Fig. 6). The progress line type proceeds relatively steadily in the city center area; between 6 AM and 7 PM the directional loads move within only slightly fluctuating bands, so that peak loads are hardly recognizable. By contrast, the rush-hour traffic peaks on the major corridors are more clearly distinctive.

Fig. 5: Daily Progress Line at Brückenstrasse, Borough of Mitte, 17 Jan. 1995

Fig. 5: Daily Progress Line at Brückenstrasse, Borough of Mitte, 17 Jan. 1995

The representation on the map is based on figures mathematically prepared from the average daily traffic volume (DTV) results, which cannot show these seasonal, weekday and/or time-of-day-related fluctuations.

Fig. 6: Daily Progress Line at Frankfurter Allee, Borough of Friedrichshain, 21 Oct. 1993

Fig. 6: Daily Progress Line at Frankfurter Allee, Borough of Friedrichshain, 21 Oct. 1993

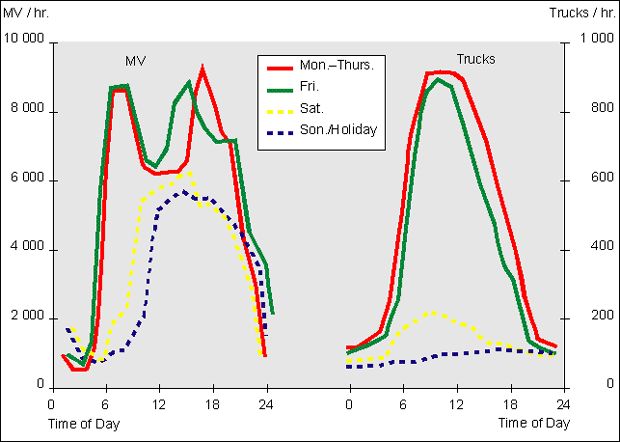
Short-term (four-hour) counts were undertaken at approx. 360 measurement points. Because of the hourly fluctuations of the traffic flow for a day, a separate projection factor was to be determined for each distance from available 12-hours counts at continuously registering long-term measurement points, with which the count data could then be projected to the 12-hours traffic level (7 AM to 7 PM).

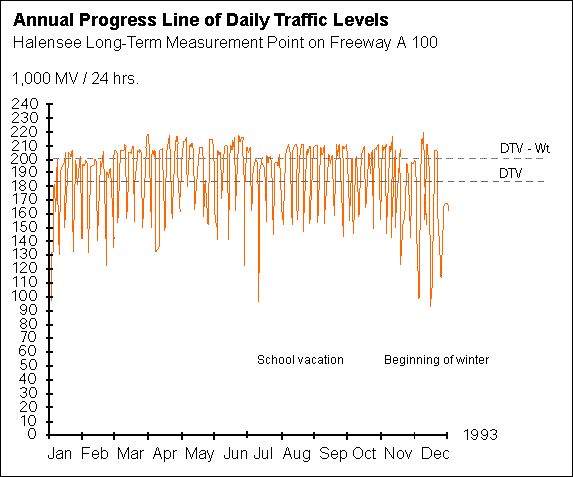
To also account, over and above this, for the seasonal fluctuation in motor-vehicle traffic through the effects of weather and vacation periods, the 12-hour data were subsequently multiplied by week factors, which were likewise ascertained at the automatic long-term measurement points.

As the last step, the projection to 24-hours values, separately by DTV-Wt and by DTV, was then still necessary.

Construction point situations are not specially marked. Particularly in the eastern boroughs, various construction points and detours existed during the counts. Since the counts were carried out over several years, the traffic volume was adjusted to a uniform traffic-network situation.

A clear increase in traffic volume can be ascertained in comparison with the 1985 Umweltatlas. The differentiation into traffic-volume categories therefore had to be reduced in the lower range. The inner-city highways provide clear examples for increased traffic volumes.

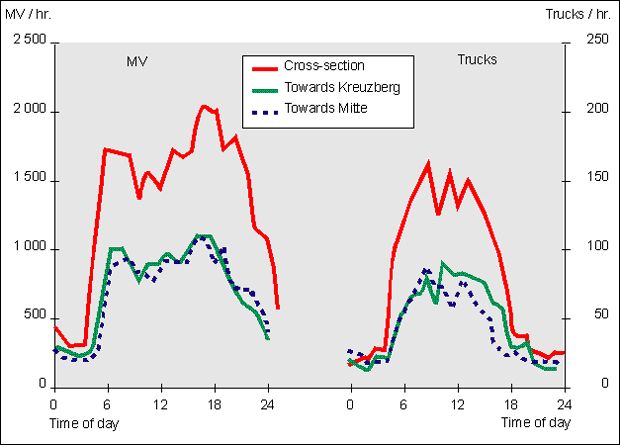
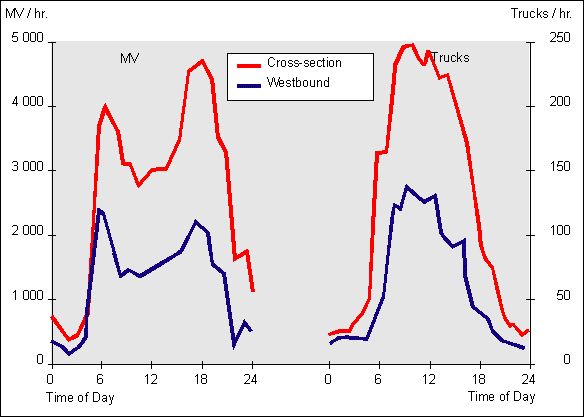
On some road segments, the directional lanes are spatially separate. This is the case, for example, for the freeway segment near the International Congress Center (ICC), and for the canal-shoreline roads in Kreuzberg. On the map, the different directional lanes may be shown in different colors for these segments than would be the case if, as with other streets, they were shown as the sum of both directional lanes.