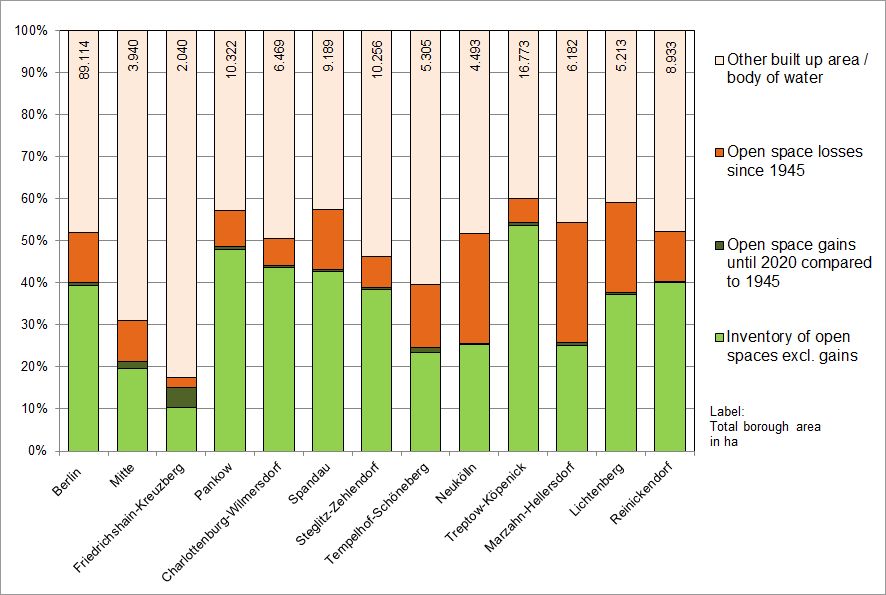
Individual gains in open space, mostly due to the impacts of war and the subsequent and division-related decommissioning of large railway facilities, are predominantly found in the inner city. Some of these areas, which initially lay fallow for decades, were later converted into parks, such as the Görlitzer Park, the parks at Gleisdreieck or the Mauerpark.
The extensive consumption of hitherto non-built-up areas in East Berlin after World War II began approx. twenty years later than in West Berlin. In West Berlin, most open spaces were built up between 1950 and 1970, while in East Berlin, this occurred during the 1970s and 1980s. These differences in urban development reflected the political division of the city after World War II (cf. also Environmental Atlas Map “Building Age in Residential Development” (06.12) SenStadtWohn 2018).
At the end of the war, approx. 30 % of all buildings had been totally destroyed or seriously damaged. The districts of Mitte and Tiergarten were the most strongly affected; there, this concerned more than 50 % of all buildings; in Friedrichshain, it was 45 %. Initially, the economic situation in both the Soviet and the western sectors restricted building activity largely to repair. After the end of the blockade in 1949, West Berlin was able to profit from US economic aid under the Berlin construction programme. By contrast, East Germany and East Berlin were additionally burdened by reparation confiscations and dismantling.
During the 1950s and 1960s, the urban-development strategy of the West Berlin (re-)construction programme consisted in the separation of municipal functions and the relief of urban centres from dense construction. In the inner city,either areas cleared of rubble were rebuilt, sometimes with generously spaced buildings (for example, in the Otto-Suhr-Siedlung west of Moritzplatz), or open spaces that had previously been used as allotments or for other purposes were built on for housing development projects (Schillerhöhe in Wedding). In terms of existing housing, many blocks were extensively de-cored, demolished and rebuilt. New housing estates were also built, however, on formerly built-up areas destroyed during the war, e.g. the Hansaviertel in Tiergarten as part of the International Building Exhibition (IBA) in 1957.
On the outskirts of the city, meanwhile, the construction of the first larger housing estates (e.g. on former farmland and allotment garden areas at Falkenhagener Feld) and new commercial districts had begun on former open spaces.
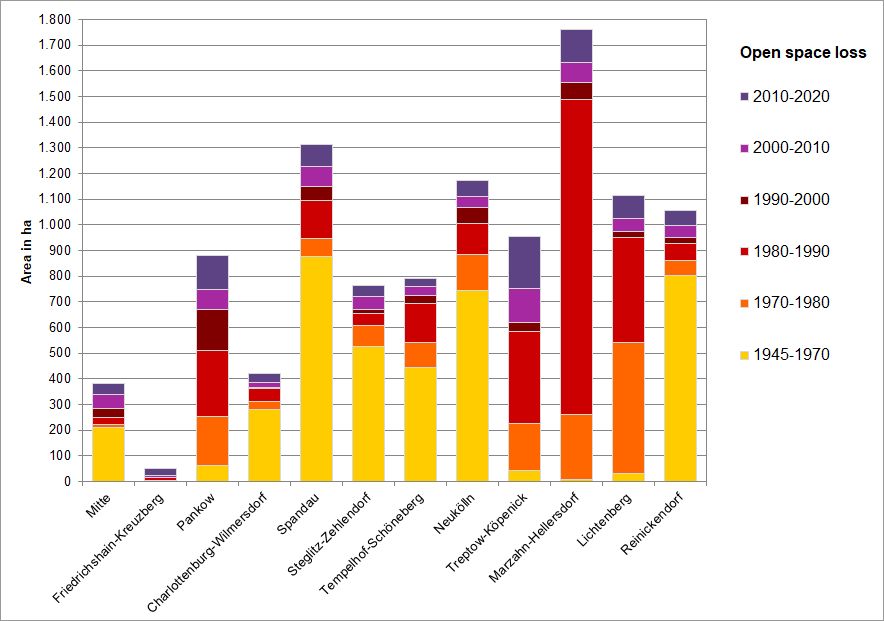
From the mid-1960s to the mid-1970s, the well-known large housing estates were built on the outskirts of Berlin. Examples were the satellite towns Gropiusstadt in Neukölln and Märkisches Viertel in Reinickendorf.
During the 1970s, construction activity was concentrated on the revitalisation of the inner city.
During the 1980s, when the demand for living space had essentially been met, construction activity was in general confined to small fallow areas which were, for instance, built up in the context of the International Building Exhibition in 1984-87. Only rarely did any major consumption of open space occur. New industrial and commercial areas were established in Ruhleben, Marienfelde, and west of Neuköllnische Allee.
The few areas built up after 1990 involved compact residential areas on former ruderal and allotment-garden areas in Spandau, Steglitz, Rudow and Reinickendorf, as well as the buildings around Potsdamer Platz.
As a reaction to an increasing apartment vacancy rate, construction of multi-storey residential buildings declined sharply after 2000; in many plans for urban expansion and utilisation-change of areas, plans for such buildings were cancelled. A few new apartment buildings can be found in Frohnau, Buckow, Dahlem, Lichterfelde West and Altglienicke. Single-family housing moved into the foreground. The Regierungsviertel (government quarter) was completed. In line with the requirements of the Planwerk Innenstadt (inner city plan) and its updated version Planwerk Innere Stadt (interior city plan, SenStadt 1011), the development of the inner city was a clear priority. Less than 10 % of land consumption was allotted to urban expansion (e. g. in the former Diplomatenviertel (Diplomats’ quarter), the new building of the Foreign Intelligence Service of Germany (BND) at Chausseestraße between Potsdamer Platz and Pariser Platz). Since its low in 2006, residential construction has been on the
rise again (SenStadtUm 2011).
Increased land consumption also occurred for reasons other than the construction of housing, for large-scale retail and traffic projects, such as the A 100 motorway in the extension from Gradestraße in Neukölln.
In East Berlin, the reconstruction of the city proceeded only slowly. During the 1950s, the most important industrial plants and utilities were brought back into operation, and residential buildings that could be fixed were provisionally restored, but there was hardly any concerted construction of new residential buildings. The only important project was the construction of the buildings on Stalin-Allee (today Karl-Marx-Allee) at the beginning of the 1950s in the context of the National Construction Programme, the counterpart to the West Berlin construction programme.
Only during the 1960s, after the construction of the Wall and the industrialisation of the East Berlin construction industry, did the reconstruction of the city centre begin. The goal was the fundamental restructuring of the city centre. The old tenement apartments were to give way to new buildings. The extensive demolition plans failed however, because of the difficult economic conditions and because of the existing housing shortage. At first, the areas along Unter den Linden and Karl-Liebknecht-Straße, around Alexanderplatz, and along Karl-Marx-Allee up to Frankfurter Allee, heavily destroyed during the war, were rebuilt. New construction then continued in the Fischerkiez (the southern part of the main Spree Island), and along Leipziger Straße.
The reconstruction of the city centre during the 1960s did not lead to any major loss of open space. However, the concentration on restructuring the city centre led to the neglect of new housing construction. Discontent with the living situation increased among the East Berlin population. As a result, the housing programme was proclaimed as the main emphasis of the social program in 1971. The goal was the elimination of the housing shortage through the construction of new apartment buildings and through the rehabilitation of the old buildings in the city centre, which had until then been neglected. During the 1970s and 1980s, large satellite towns were built on formerly open space by means of industrial prefabricated construction, with an immense mobilisation of labour from all over East Germany. New boroughs were established: Marzahn in 1976, Hohenschönhausen in 1979 and Hellersdorf in 1980. Other, albeit considerably smaller, residential estates were built along the entire
periphery of East Berlin through 1990.
The large development areas of Marzahn, Hohenschönhausen and Hellersdorf arose to a large extent on the former sewage fields of Malchow and Hellersdorf which were closed down in 1968-1969. Near-natural areas along streams such as the Wuhle or Nordgraben were not built up, since the underground was not suitable for construction. However, smaller near-natural areas, such as pools, were often filled in and built upon.
In new residential areas or large housing estates on large contiguous open spaces, some small, isolated green spaces of no recreational or free-time value were sometimes left behind. One example is the construction carried out during the 1970s and 1980s in Lichtenberg, between Rummelsburger Straße and Saganer Straße. All that remained here of this large, formerly horticulturally or agriculturally used area was a narrow strip of parkland and a little green space.
The expansion of industrial and commercial areas also contributed to loss of open space. The losses in the Rhinstraße/ Gehrenseestraße/ Hohenschönhauser Straße area, along Märkische Allee, and along the motorway in Pankow were particularly high.
For the development of the city as a whole, post reunification, the following picture emerges:
After 1990, a few concrete-plate blocks which had already been planned or started were completed in Hohenschönhausen and Marzahn. The largest residential areas were built in the urban-expansion areas certified under the 1994 Land-Use Plan (FNP 94) in Buchholz and Karow-Nord.
In the decade 2000-2010, new residential areas were built primarily in
Falkenberg, Biesdorf-Süd, Buchholz, Wartenberg and in Adlershof.
Overall, during the first two decades after reunification, 85 % of urban development in Berlin took place within the body of the city, while only 15 % extended beyond it (SenStadtUm 2011).
Areas that have been newly developed since 2010 are distributed across the entire urban area, although they tend to be more located on the outskirts and in the East of the city. New development is now no longer represented by large new housing estates, as was the case in the 1970s and 1980s, which is also evident from the average size of open space loss. New development now involves smaller, scattered areas. Up until 1990, the average size of newly built-up areas was about 7 ha. It has since dropped to a value of 1.9 ha in the decade between 2010 and 2020.
Larger construction projects from the decade between 2010 and 2020 include the residential and commercial buildings in Adlershof, the Europacity development project and new commercial buildings around Berlin Central Station and the extensions of single-family housing estates, e.g. in Gatow, along the Oberhavel river, in Biesdorf and Haselhorst. A residential project is currently under construction in Rummelsburger Bucht (bay on the Spree).
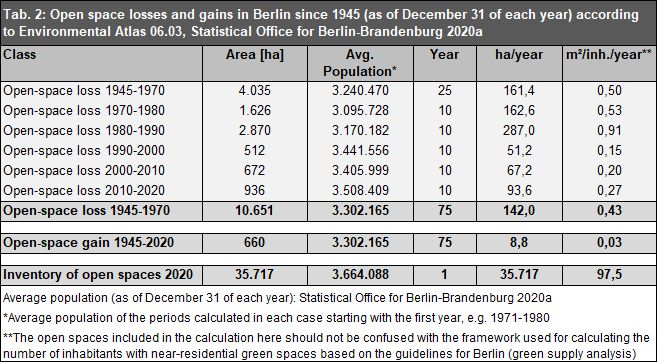
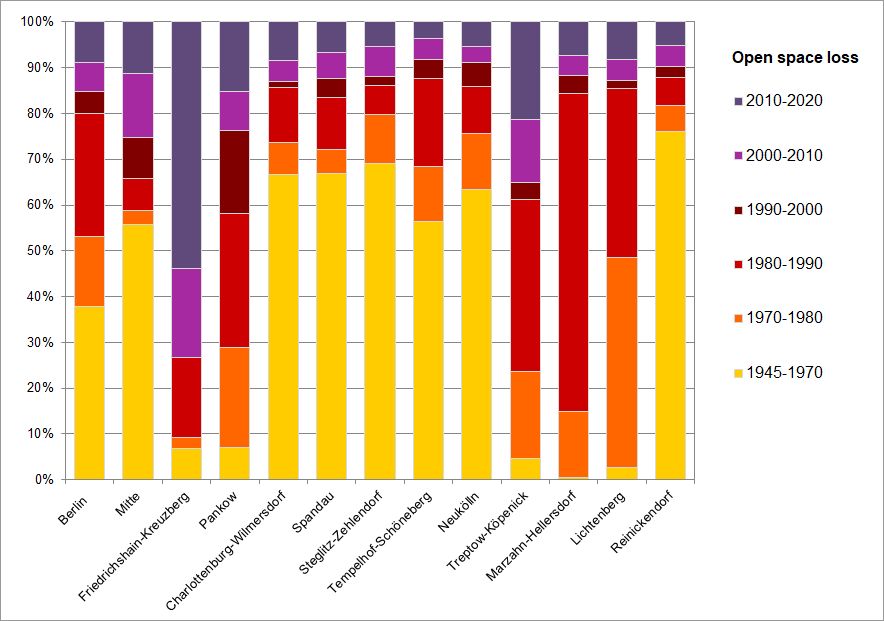
Comparing the totals of the last three decades (from 1990) reveals a clear increase of open space loss. For the decade between 1990 and 2000, a total open space loss of 512 ha was determined based on this map. The total loss of the current decade is 82 % higher (936 ha, cf. Table 2).
Finally, it should be noted that the monitoring of this map c*annot record and balance the small-scale losses* of vegetation-covered areas, as they are often located inside or at the edge of residential and commercial areas. In the case of retrospective densification and additions to existing buildings, these areas often fall below the lower threshold of 1 ha of the geometric basis of the Urban and Environment Information System (ISU), meaning that these losses cannot be taken into account. “Land consumption” is therefore not the same as an increase in impervious soil coverage. The two terms describe distinct processes and are also considered separately in the environmental policy discourse. While land consumption, in short, describes the increase of the area used predominantly for construction or residential purposes, the exact composition of impervious and pervious areas of these use categories is disregarded in this map. There is a separate Environmental Atlas
Map dedicated to mapping the impervious soil coverage.