Groundwater Levels and Catchment Areas for Waterworks 1990

Groundwater Levels: Methodology

Development of Depiction

Because the questions previously described remain unclear, the scale for the all-Berlin groundwater contour map was changed. Instead of the 1:50,000 scale used in the Gewässerkundlichen Jahresbericht (Hydrological Annual Report), groundwater contours are depicted at a scale of 1:125,000.

The contour maps of near-surface groundwater were produced with a computer-aided method for the spatial interpolation of point scattered initial data. The process for preparation of contour line-drop maps (SCOP) connected to the Berlin environmental information system served as methodological instrument. A linear function with a basic grid of 700 m was chosen as base function.

Observation wells for a sufficiently dense and regularly distributed data network were selected according to the following criteria:

  • filtering in near-surface groundwater aquifers (as far as known)
  • position of measuring points to each other
  • an observation period as long as possible

A total of 950 observation wells in Berlin remained, depicted in Figure 1, and 50 observation wells in the surrounding areas.

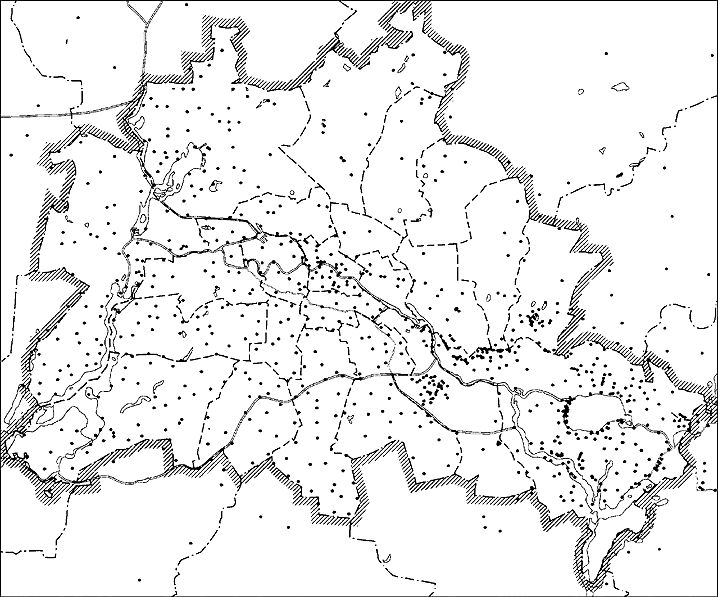
Fig. 1: Distribution of Groundwater Observation Wells Used for the Calculation of Groundwater Levels

Fig. 1: Distribution of Groundwater Observation Wells Used for the Calculation of Groundwater Levels

The course of average deviation of groundwater levels from the long-term average helped select representative time periods of relatively higher and lower groundwater levels (cf. Map 02.07).

The following time periods were selected for depiction:

  • May 1976 as period of relatively low groundwater levels
  • May 1988 as period of relatively high groundwater levels
  • May 1990.

The month of May (end of winter) gives the time period of comparatively higher groundwater levels in the course of the water management hydrographic year (November-October).

Confined Groundwater Conditions

There were problems in determining the first groundwater aquifer, especially in the Barnim flat upland area, as well as in other areas with confined groundwater conditions. The determination was made more difficult by sandy-gravelly interstratifications in the marl strata of the flat upland area where – independent of the groundwater aquifer – perched groundwater can form. Misinterpretations can be expected here due to complicated geological conditions. This could lead to water levels deviating in meter range from those depicted on this map, especially in the Barnim flat upland area, according to available knowledge.

The depiction of observation well levels of groundwater can be misinterpreted very easily in areas where groundwater may be confined under and pressing against a thick, impermeable or semi-permeable marl mantle. Groundwater may climb through the drilled mantle, up the pipes of the groundwater measuring station, up to the measured gauge level. These areas were therefore separately classified on the basis of available knowledge.