Individual depictions of the _isohyets_ (contour-lines) of long-term precipitation distribution were prepared from individual values of the 97 monitoring stations in two partial steps, supplementing each other, in a computer-supported process:
1) A regular grid of precipitation values was generated out of the irregularly distributed basic data by using a geo-statistical process (Kriging). A basic grid scale of 1,000 m was selected (cf. Kannenberg 1991 and 1992);
2) A spatial interpolation of grid estimated values was performed with the help of a procedure for establishing contour-drop maps (SCOP) (cf. Map 01.09, SenStadtUm 1992a) integrated in the Environmental Information System (Umweltinformationssystem, UIS) Berlin.
West Berlin values (described above) were taken from the time series 1961 – 90, and values for East Berlin/surrounding countryside were taken from the years 1951 – 80. A total of seven stations in East Berlin/surrounding countryside had both time series. Deviations from the average values of the 30 year observation periods averaged 1.1 % and were thus negligible in comparison to the total difference of about 20% between the entire collected data. A dense and good data base could be assumed, compared with other urban study areas.
Time periods selected for representation were:
- long-term annual average 1961 – 1990
- long-term summer half-year average 1961 – 1990
- long-term winter half-year average 1961 – 1990.
The time-frames were divided into a summer half-year from May to October and a winter half-year from November to April, in order to be consistent with the water management runoff year (November – October).
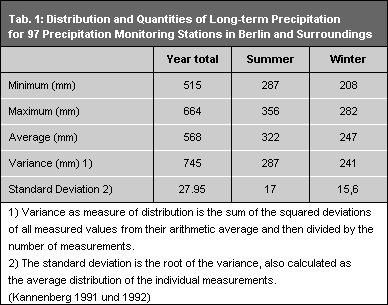
Table 1 gives some elementary statistical parameters for these three time periods for all monitoring stations.