Groundwater Levels of the Main Aquifer and Panke Valley Aquifer 2019

Map Description

The present groundwater contour map describes the groundwater situation of the main aquifer with violet groundwater isolines and the Panke Valley aquifer in north-eastern Berlin with blue isolines. The interval between the groundwater isolines is 0.5 m. These show the potentiometric surface area of the unconfined and confined groundwater, respectively (see also Fig. 3). In areas of the main aquifer with confined groundwater, the groundwater contours are displayed in broken lines. In areas with no main groundwater aquifer, or with an isolated main groundwater aquifer of low thickness, no groundwater isolines are displayed. Those areas are shown with black dots.

The map is based on the topographical General Map of Berlin, scale of 1 : 50,000, in grid format, and the geological outline for the Berlin state territory, at a scale of 1 : 50,000, which was derived from the geological General Map of Berlin and Surrounding Areas, scale of 1 : 100,000. In addition, the used groundwater observation wells, as well as the individual waterworks are indicated, with their active wells and the water protection areas.

Hydrogeological Situation

On the plateaus, the main aquifer is extensively covered by the glacial till and bolder clay (aquitards) of the ground moraines. Wherever the potentiometric surface of the main aquifer lies within such an aquitard, groundwater conditions are confined. In sandy segments above the till or in isolated sand lenses, near-surface groundwater may be formed, which is also called stratum water (see also Fig. 3). After extreme precipitation, it may rise to the surface. The groundwater levels of these locally highly differentiated areas have not been separately determined and portrayed.

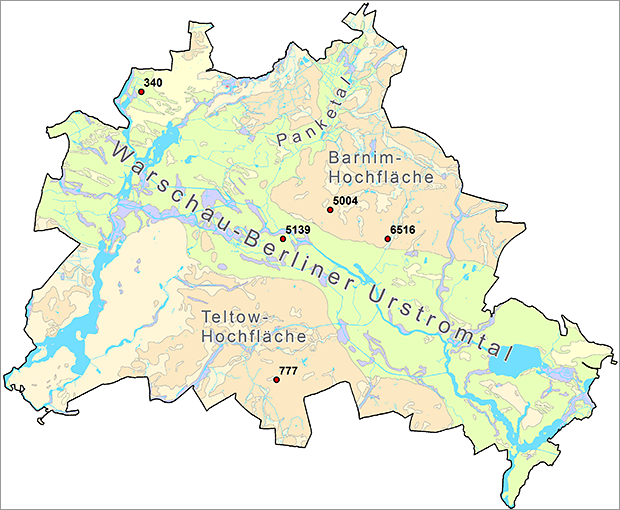
In the Panke Valley, on the northern side of the spillway, the Barnim plateau, a major independent coherent aquifer has developed. It is located above the main aquifer, which is covered by the glacial till of the ground moraine (see also Figs. 7 & 8). On the present map, this aquifer is indicated by separate blue groundwater isolines. The glacial till is thinning out toward the Warsaw-Berlin glacial valley and the Panke Valley aquifer is interlocking with the main aquifer.

For more information, see the Groundwater Brochure:
www.berlin.de/sen/uvk/_assets/umwelt/wasser-und-geologie/publikationen-und-merkblaetter/grundwasser-broschuere.pdf (only in German)

Current Situation in May 2019

As a rule, the hydraulic gradient in Berlin, and hence, too, the flow direction, is from the Barnim and Teltow plateaus and the Nauen Plate toward the receiving bodies, the Spree and Havel Rivers. Depression cones have formed around the wells that were active during the measurement period, and have lowered the phreatic surface below the level of the neighbouring surface waters. Thus, in addition to inflowing groundwater from the shore side, the water pumped here also includes groundwater formed by infiltration (bank-filtered water) from these surface waters (see also Fig. 4c).

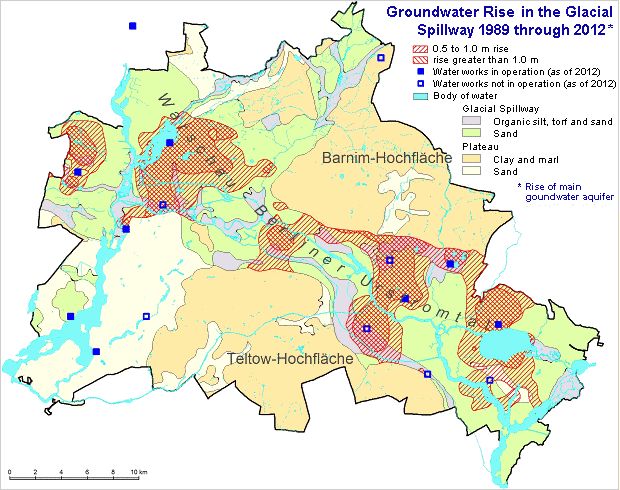
In May 2019, too, the potentiometric surface, which has been lowered in Berlin by drinking-water discharge over the past hundred years, was at a relatively high level compared to 1989 (Limberg et al. 2007: pp. 76 ff.). Areas in the glacial spillway in which the groundwater re-rose over this period of time by more than half a meter and by more than one meter, respectively, are shown on the difference map 1989-2012 (Fig. 10). Since 2012, the long-term mean of the groundwater level is tending to decrease in most parts of the city area.

Fig. 10: Groundwater rise in the glacial spillway between 1989 and 2012

Fig. 10: Groundwater rise in the glacial spillway between 1989 and 2012

The reduced raw-water discharge by the Berliner Wasserbetriebe since 1989 as a result of the decreased need for drinking and industrial water is responsible for the constant rise of the groundwater level. Moreover, five of the smaller Berlin waterworks (Altglienicke, Friedrichsfelde, Köpenick, Riemeisterfenn and Buch) were shut down altogether since 1991. In addition, drinking water production at the two waterworks Johannisthal and Jungfernheide has been discontinued temporarily since September 2001; at the latter, also artificial groundwater recharge was put on hold. However, under the immediate water management measures of the former Senate Department for Urban Development and the Environment, groundwater is still being discharged at the Johannisthal location in order to support current local waste disposal and construction measures. Likewise at the Jungfernheide location, groundwater was discharged by the Senate Department through the end of 2005. Since January 2006, a private company has performed the groundwater management there for continuing the dewatering of the cellars.

The water protection area of the waterworks of Buch, Jungfernheide and Altglienicke were abolished in April 2009.

The overall discharge of raw water by the Berliner Wasserbetriebe for public water supply dropped by almost half (42 %) in Berlin over a period of 28 years. In 1989, 378 million m³ water was pumped, as opposed to 219 million m³ in 2002. In 2003, the discharge briefly increased slightly to 226 million m³ due to the extremely dry summer. After a further phase of decline until 2014, the discharge increased again in the past years to 235 million m³ in the year 2018 (Fig. 11).

Fig. 11: Development of the raw water discharge since 1990

Fig. 11: Development of the raw water discharge since 1990

The development of the groundwater levels from May 2017 through May 2018 is exemplified at four groundwater observation wells which are largely unaffected by the withdrawal of water by the waterworks (Fig. 12).

Fig. 12: Position of the five largely unaffected groundwater observation wells: 340 and 5139 in the glacial spillway, 777 on the Teltow plateau, and 5004 as well as 6516 on the Barnim plateau

Fig. 12: Position of the five largely unaffected groundwater observation wells: 340 and 5139 in the glacial spillway, 777 on the Teltow plateau, and 5004 as well as 6516 on the Barnim plateau

Figure 13 shows the groundwater level at two observation wells (340 and 5139) in the unconfined aquifer of the glacial valley.

At the observation well 340, which is located on the outskirts of the city next to an agricultural area, the groundwater level follows the expected annual cycle. The groundwater level decreases over the summer months until the end of September 2018 and then rises again from October 2018 to April 2019.

Both observation wells show a quick reaction to a precipitation event in July 2018. The increase is stronger in the observation well 340 (0.15 m) than in the observation well 5139 (increase by approx. 0.07 m), which is located in the inner city area with high soil sealing and drainage of rainwater via the sewage system.

Due to the overall very low rainfall during the observation period, the groundwater level at the observation well 340 decreased from May 2018 to May 2019 by approx. 0.25 m (Fig. 13 and Fig. 15). The groundwater level at the observation well 5139 shows a very low seasonal change that is mainly influenced by groundwater-surface water-interactions and by the regulations of the river Spree.

Fig. 13: Hydrograph of the groundwater level at two groundwater observation wells in the glacial valley from May 15, 2018 to May 15, 2019

Fig. 13: Hydrograph of the groundwater level at two groundwater observation wells in the glacial valley from May 15, 2018 to May 15, 2019

For a contrast, the development of the groundwater levels of the covered confined aquifer on the Teltow plateau and on the Barnim plateau are shown by way of example on the observation wells 777 and 5004 as well as 6516 in Fig. 14.

Due to the extremely low rainfall in the period from May 2018 to May 2019 (see also Fig. 15), a drop in groundwater levels can be observed on both plateaus. While the water level is decreasing at the area of the Teltow plateau (observation well 777) during the complete period, the water level at the area of the Barnim plateau is decreasing only until December 2018. After that, the water level stays stable (observation well 5004) or is increasing again (observation well 6516).

Fig. 14: Hydrograph of groundwater level of three groundwater observation wells on the Teltow plateau (777) and on the Barnim plateau (5004 and 6516) from May 15, 2018 to May 15, 2019

Fig. 14: Hydrograph of groundwater level of three groundwater observation wells on the Teltow plateau (777) and on the Barnim plateau (5004 and 6516) from May 15, 2018 to May 15, 2019

From June 2018 until May 2019, the cumulative precipitation amount of 374 mm at the climate station “Berlin-Tegel” was significantly lower than the long-term mean (1981-2010) of 549 mm. Only the months of July 2018, December 2018 and January 2019 showed average rainfall. In July 2018, however, these are largely due to a heavy rainfall event. Above-average rainfall was recorded in March 2019 only.

Deviating from the explanations of the last years, in these years explanations the data from the DWD measuring station Tegel are shown, as there is no data available for the month of May 2019 for the otherwise shown measuring station of “Berlin-Tempelhof”.

Fig. 15: Monthly precipitation between May 2018 and May 2019 at the climate station "Berlin-Tegel", compared with the long-term mean, 1981 through 2010

Fig. 15: Monthly precipitation between May 2018 and May 2019 at the climate station "Berlin-Tegel", compared with the long-term mean, 1981 through 2010

Information on the expected highest groundwater level (EHGL), which is an important basis for planning the design of buildings, can be found in the Environmental Atlas under: Map EHGL (Limberg et al. 2015).