Content-based approach
The Berlin approach to assessing environmental justice mainly relies on the analysis and aggregation of available data. It is designed as a two-stage process with five core indicators:
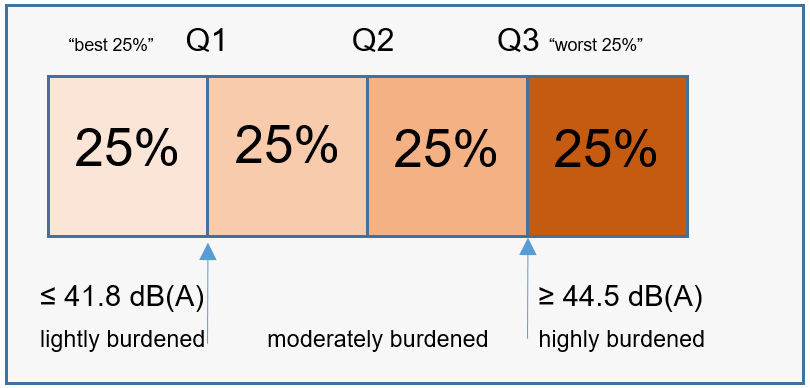
- Noise burden
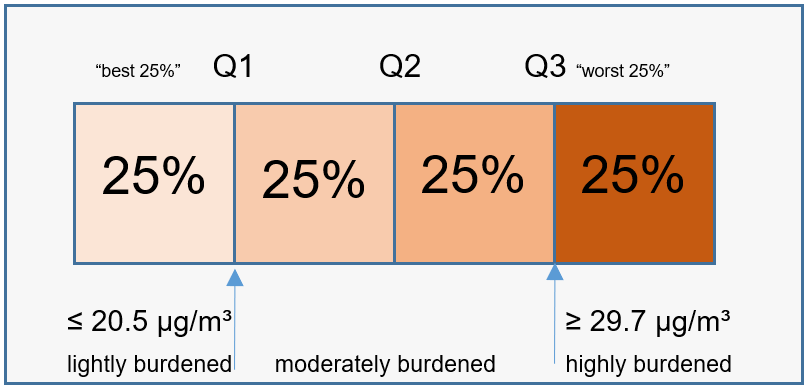
- Air pollution
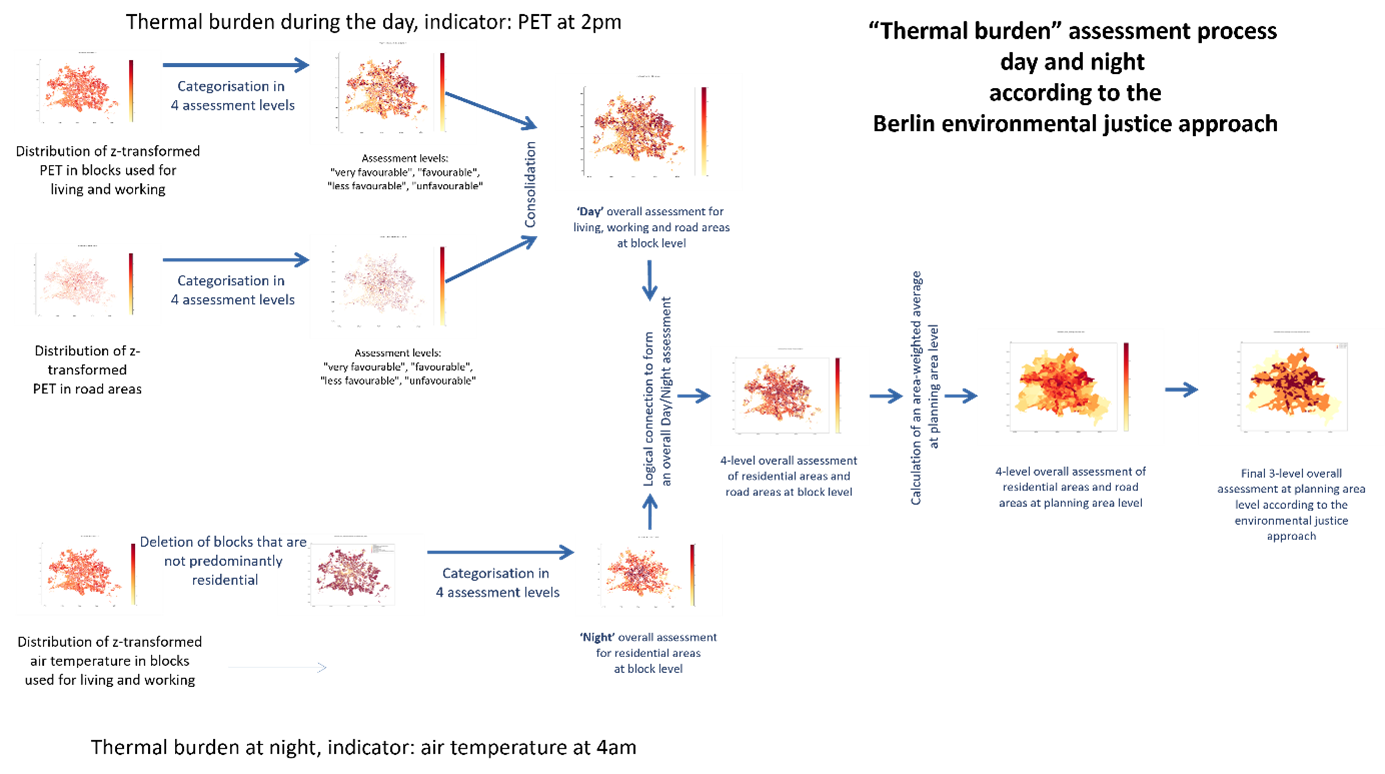
- Thermal burden
- Green space supply
- Social disadvantage
- Multiple Burden Map – Environment
- Multiple Burden Map – Environment and Social Disadvantage – and
- Berlin Environmental Justice Map.
“Three particular challenges may be identified in the process of merging these data sources: the sectoral data differs in their survey methodology, in their spatial depth and in their periodicity. For the Environmental Atlas, urban development policy planning areas were chosen as the smallest unit of analysis from the system of living environment areas (LEA). The sectoral data was then converted accordingly. The heterogeneous data situation with regard to the survey methodology and spatial depth could thus be mitigated for the purposes of this analysis” (translated from SenUMVK 2022, p. 6).
In the first step of the analysis, the data on the three core indicators “air pollution”, “noise burden” and “thermal burden” was analysed and consistently assigned to the characteristics “high”, “medium” or “low” on an ordinal scale, according to the health risk. The other core indicators “green space supply” and “social disadvantage” were classified similarly in three levels, without a health-related weighting, however.
In a second step, the individual core indicator maps focusing on one theme each were merged to illustrate the distribution or overlap of the environmental burdens (“Integrated Multiple Burden Map – Environment”) as well as the environmental burdens including social vulnerability (“Integrated Multiple Burden Map – Environment and Social Disadvantage”). At planning area level, the two maps present a range starting from PLA without any core indicator exhibiting a high burden up to PLA with four- to fivefold burdens (cf. Fig. 2).