Building and Vegetation Heights 2012

Statistical Base

Breakdown into project phases

The full-coverage processing of the area of the City of Berlin and its immediate surroundings is being carried out in two separate processing steps, which are distinguished both in terms of the available data bases and of the different morphological characters of the two working areas.

While in Phase 1 for an area of approx. 445 sq km in the city of Berlin, data very rich in detail were gathered, the data resolution was significantly less in Phase 2 on the remaining urban area and the immediate surrounding area of Berlin, an area of approx. 1,800 sq km (cf. Figure 2). This difference was due to the much more homogeneous structural and vegetation characteristics of the marginal areas of Berlin and the surrounding region. In the following, primarily the data collection and its processing during the first phase of the project, and with regard to the territory covered during that phase, are described.

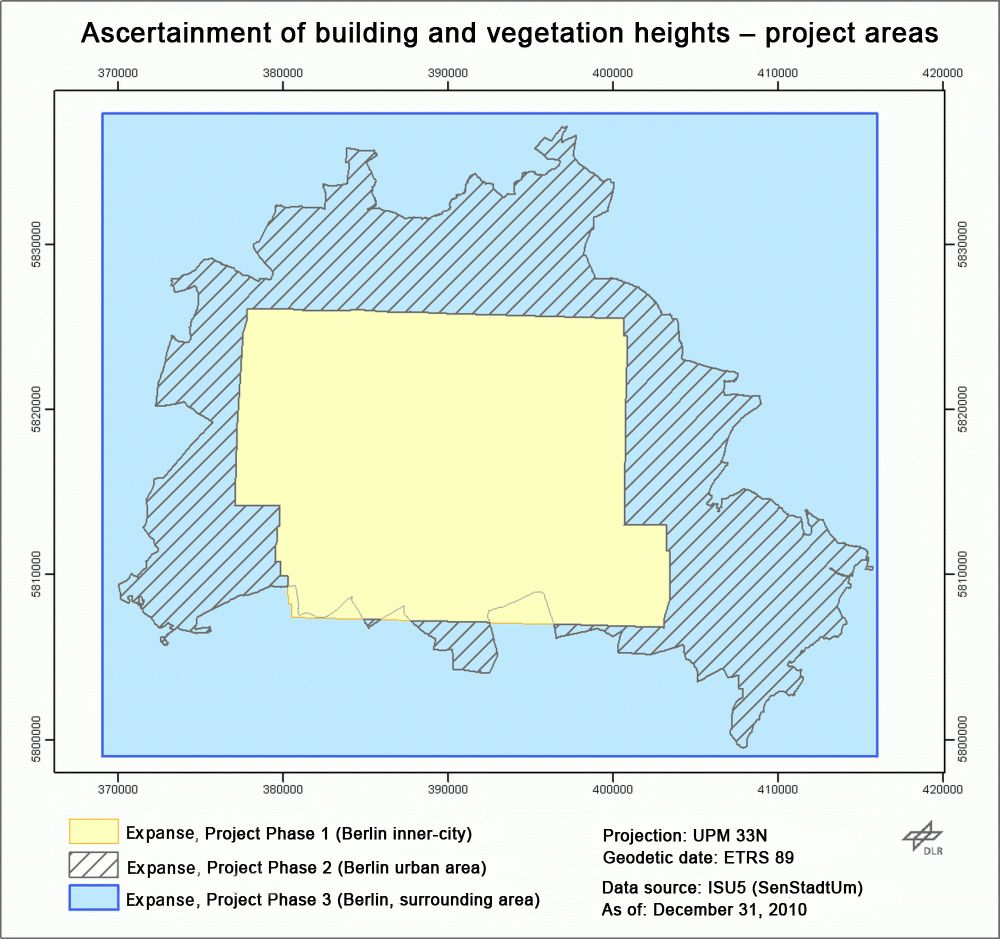
Fig. 2: Extent of the project area: Area of the city of Berlin and surrounding areas

The 2009/2010 aerial photography flights and the images obtained

A Vexcel UltraCam X digital aerial photography camera was used to obtain the images. The basic principle of this camera model is the separation into two classes, each with various lenses, with one class providing the panchromatic image, and the other colour images in the channels red, green, blue and infrared, in this case with a pixel resolution of 14,430 × 9,420, via a CCD sensor.

Matrix camera photography uses digital matrix-shaped large-area sensors and central projection. The depiction of the earth’s surface is thus limited to a rectangular, usually square image segment. Adjacent image segments overlap by approx. 60%; this overlap serves to subsequently compile an overall mosaic, and also to generate the surface model of the image area depicted. The GPS/INS (Inertial Navigation System) provides a highly precise orientation of the image data.

The aerial photography flight project over the Berlin inner city was conducted during the early autumn of 2010, and that of the outskirts of the city and the surrounding areas during late summer of 2009. The most important aerial photography parameters from the flight logs in the technical report are compiled below.

They show that the quality of the aerial photographic material during the two project phases was very different. This fact, for example with regard to the radiometric resolution of 10 cm in Phase 1 as opposed to 50 cm in Phase 2, is also reflected in divergence of precision of the ascertainment results, the quality of which must be considered in the context of these different input data.

Project Phase 1 (inner-city area) Project Phase 2 (outskirts area)
Camera and product data:
Sensor UltraCam X matrix camera (Vexcel GmbH, today Microsoft) UltraCam X matrix camera (Vexcel GmbH, today Microsoft)
Photographic products True-colour image (TCI) and infrared channel (IR), digital surface model (DSM) True-colour image (TCI) and infrared channel (IR), digital surface model (DSM)
Ascertainment data:
Date of photography Sep. 23, 2010; 8:05 / 11:24 a.m. CEST Aug. 24, 2009; 7:55 – 11:50 a.m. and 2:05 – 4 p.m. CEST
Flight carried out by BSF Swissphoto GmbH BSF Swissphoto GmbH
Ground resolution 10 cm 50 cm
Longitudinal/ transversal overlap 80 / 60 % 80 / 40 %
Flight strips 17 13
Total number of images 1.793 416
Aero-triangulation Trimble Inpho Trimble Inpho
Surface generation Software UltraMap (Microsoft) Semi-Global Matching (DLR)
Altitude above ground Approx. 2,090 m Approx. 7,000 m
Extent::
Geographic extent 445 km2 1.800 km2
Coordinates:
Coordinate system UTM, Zone 33N UTM, Zone 33N
Geodetic date ETRS89 ETRS89
Reference ellipsoid GRS80 GRS80
GPS:
GPS reference station SAPOS Station, Wilmersdorf, Berlin unknown
GPS processing precision Position and height theoretically 5-6 cm; realistically 10 cm Position and height theoretically 10-15 cm; realistically 15-20 cm

Geo-base and planning data

In addition to the above stated data, vector data in the form of statistical blocks and block segments, as well as building and street tree data (SenStadtUm 2010, 2013b) were also available, both for Project Phase 1 and for that part of the area of Project Phase 2 located within the city of Berlin. These data are completely available for all of Berlin, and include the following layers:

  • Automated Map of Properties (ALK) as of June 2012
    • The Building Layer: Buildings existing, planned or under construction, with information on actual uses and numbers of stories
    • The Street Tree Layer (as of October 2009)
    • The Topographic Layer, with basic and supplemental topography
  • City and Environment Information System Block Map 1:5000 (ISU5), as of December 2010
    • The Block Layer: Blocks and block segments, with information on urban structure and use type
    • The State and Borough Layers
    • The Prognosis Area Layer.

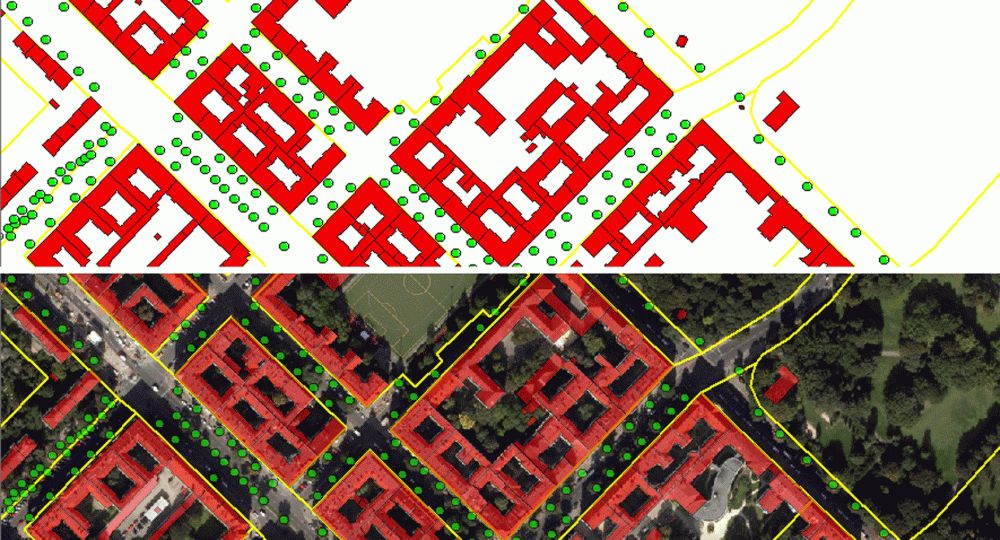
The ISU5 Block Map constitutes the reference geometry for the ascertainment of the items to be determined, and their heights. The area of the city includes some 25,000 blocks and block segments. The extracted objects are cross-referenced to the block keys with a specific building key, so that each item is identifiable not only by its precise position, but also by its attribution to a certain type, and to a block and a block segment number (cf. Figure 3).

For the surrounding areas in the state of Brandenburg (Project Phase 2), the following additional vector and create data were also available:

  • ALKIS as of October 2013, with the layers
    • buildings, and
    • actual use areas
  • Digital terrain model (DTM), at a spatial resolution of 1 m (DTM1)

Note: The altitude data ascertained for the surrounding areas in the State of Brandenburg are not available online

Fig. 3: Section of the geo-base and technical data used: ALK building layer (red), ISU5 block boundaries (yellow), street trees (green), with a TrueOrtho-photo background