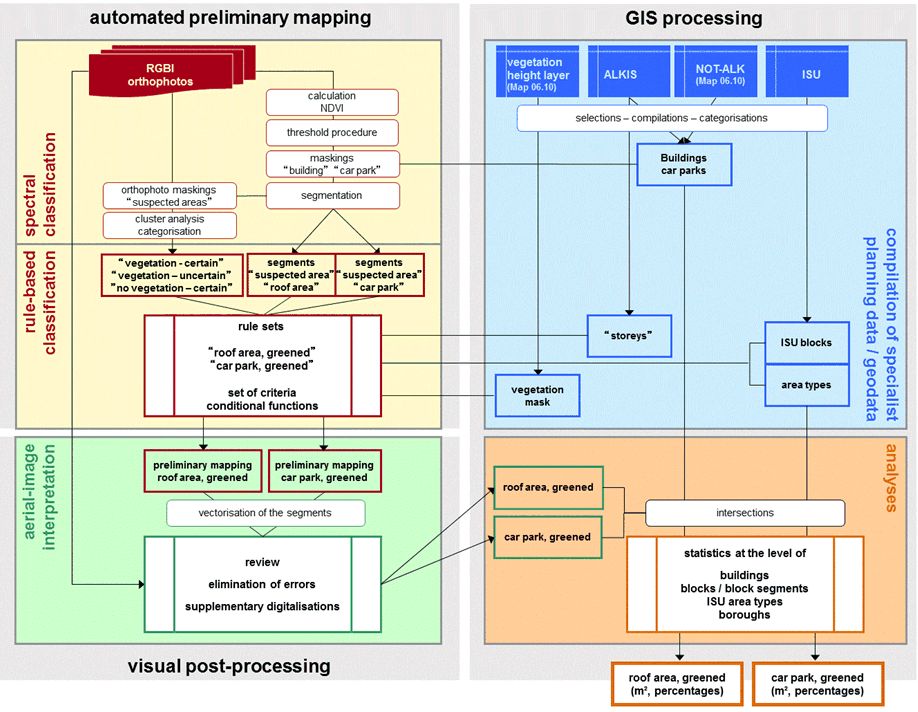
Automated preliminary mapping
In the course of the automated preliminary mapping, the object class “vegetation” should be recorded as precisely as possible within the building outlines. A combination of a spectral classification of the orthophotos using the Normalized Difference Vegetation Index (NDVI) and an unsupervised classification as well as a rule-based classification with inclusion of specialist planning data and geodata proved to be a suitable approach. The outlines of buildings and underground car parks formed the area of analysis, i.e. the search for vegetation was restricted to these outlines. Buildings that were not present in the statistical bases (ALKIS, NOT-ALK) were not analysed.
The NDVI is a synthetic channel that combines information from the near infrared (NIR channel) and the red spectral region (red channel), which causes vegetation areas to be particularly highlighted. In numerous investigations, this additional channel has proved successful in differentiating surfaces with and without vegetation cover as well as classifying degrees of sealing (Coenradie et al. 2007, Coenradie & Haag 2016b). The vegetation index was also used to identify green roofs in a comparable project for several other cities (Ansel et al. 2015). In the green roof mapping for Berlin, the NDVI served for an initial coarse delimitation of vegetation on roofs. Corresponding segments were subsequently more finely differentiated with an unsupervised classification procedure (ISODATA cluster analysis). The distribution of the spectral data was analysed automatically, and statistical clusters and spectrally similar image points were identified and combined into 100 spectral
classes. These clusters were subsequently assigned to the categories “vegetation, certain”, “vegetation, uncertain” and “no vegetation, certain”.
Finally, a rule-based classification of the vegetation segments was carried out. For this purpose, the spectral mappings were merged with selected specialist planning data and geodata in a rule set. This allowed mapping errors to be considerably reduced.
In particular, including the area types (Environmental Atlas map Urban Structure – area types differentiated (06.08)) in the rule set allowed a spatially differentiated classification of Berlin to be carried out. Thus, for example, it is to be expected that buildings are obscured to a considerable extent in the thoroughly greened parts of the city (including “Village-like mixed development (21)” or “Villas and town villas with park-like gardens (24)”) or in “Allotment gardens (37)”. In areas with new buildings (“Multi-storey residential development since the 1990s (73)”), buildings are hardly ever obscured by treetops. Tilting of buildings is mainly concentrated in areas of the type “Large estates and single-tower high-rise buildings (9)”. The rule set was adapted accordingly for a selection of area types, which allowed the mapping in these areas to be improved.
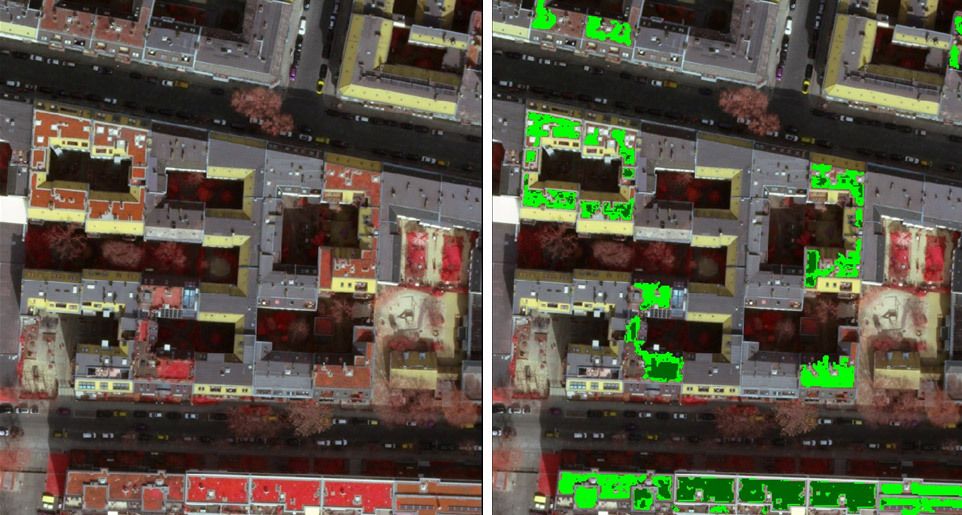
The result was a classification of the roof area into the categories “vegetation” and “no vegetation”. Based on the spectral reflection properties, the vegetation segments were further subdivided into intensive and extensive greening components (cf. Figure 2). In this context, strongly vegetated areas with vital vegetation count as intensively greened areas. Extensively greened areas exhibit weaker or possibly drier vegetation.