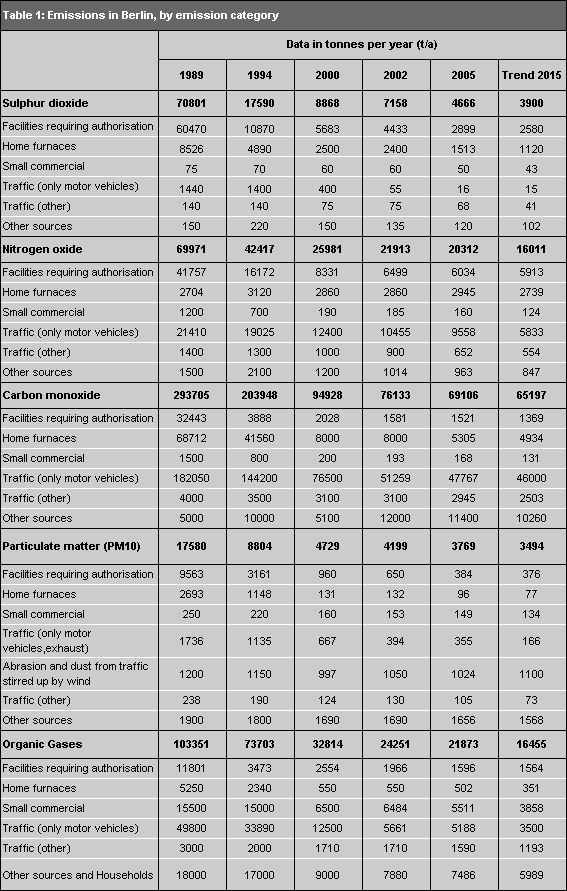
Particulate emissions from motor vehicle exhausts also decreased by more than 80%. between 1989 and 2002. This finding agrees substantially with the measurements of diesel soot in so-called “canyon streets” – the major component of motor vehicle exhaust emissions: the measured soot concentration on Frankfurter Allee, in the Berlin neighbourhood of Friedrichshain, at measurement point 174 of the Berlin Air Quality Measurement Network BLUME has dropped by almost 40 % within the past 6 years. However, since particulates from street traffic caused by abrasion and stirred up by the wind have decreased only slightly during this period, road traffic remains the second major source of particulate matter (PM10) in Berlin, after “Other sources”. Road traffic accounts for 34 % of particulate emissions in Berlin, while “Other sources” cause 40 %.
By the beginning of the 1990s, road traffic had replaced industrial plants as the main source of nitrogen oxides in Berlin. As of 2005, street traffic produced 53 % of the nitrogen oxides in Berlin, whereas industrial plants accounted for 30 % of total emissions.
Especially high in relative terms is the pollution from motor vehicle traffic in the inner city, where over one million people live in an area of 100 sq. km. Especially here, if current trends for use of and competition for space continue, motor vehicle traffic will increase. If current conditions continue, especially freight transport will encounter increased bottlenecks in the streets.
With the Urban Development Plan for Traffic, the Berlin Senate in a resolution of 8 July 2003 presented an action plan which combines the possible and necessary steps for the further development of the Berlin traffic system for the coming years with a long term strategic orientation. The core of the action plan is a catalogue of measures that were previously analysed in detail and coordinated for effectiveness, acceptability and fundability. With regard to the future development of traffic in Berlin and the surrounding area, the investigations for the Berlin Clean Air Maintenance Plan are based on this long term action concept.
“Health and Safety”, one of the key strategic components of the Urban Development Plan for Traffic, includes a number of important strategies to limit the increase of motor vehicle traffic and its associated effects, with the goal of a reduction of air and noise pollution in the primary road network. The implementation of the measures of the Urban Development Plan for Traffic is expected to be completed by 2015.
The standardised Clean Air Maintenance Plan mandated by the EU was adopted by the Berlin Senate in August 2005.Under Europe-wide standards, the Clean Air Maintenance Plan data must include information on:
- pollution measurements;
- the causes of high air pollution levels;
- the frequency and degree of instances in which the limits are exceeded;
- pollution immission and the proportions of the immission for each causative factor (e.g. industry, commercial activity, home heating, traffic);
- planned measures, and a schedule for implementation; and
- a prognosis of the goals to be achieved by such measures.
The present Clean Air Maintenance Plan provides information about the legal framework and the prevailing situation, and describes the causes of air pollution. The measures take into account future developments of the condition of the air through 2010. The focal point is the presentation of a range of potential measures and their evaluation. Based on the effectiveness of these measures, a strategy will be developed for the Berlin Clean Air Maintenance Plan. The Clean Air Maintenance Plan documents that Berlin, like many other large German and European cities, faces a major challenge to meet the new EU limits.
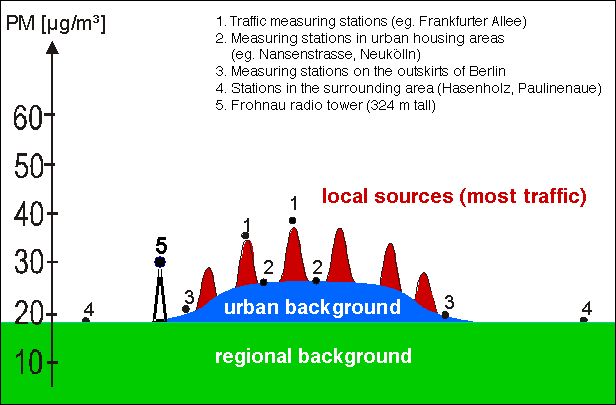
The essential results can be described summarily as follows: the locally generated segment of the pollution, which can only be reduced by Berlin measures, accounts for about half of the particulate pollution; it is caused by the urban background and other local sources. Urban background pollution is caused mostly by road traffic (16 % of the total pollution of PM10). The rest (11 %) consists of approximately equal shares of the emissions form Berlin Residential heating, Industry/ power plants, Construction, and Other sources in the city.
The results of the measurements of recent year and the model calculations carried out for 2005 lead, among other things, to the following conclusions:
- The multi-year trend of particulate and nitrogen dioxide pollution shows only a very slight decline. The high PM10 values in 2005 and 2006, and the drop in 2007 and 2008 are largely due to the weather.
- In 2005 and 2006, the 24-hour values for particulates and the annual values for nitrogen oxide were exceeded at all measurement points located close to traffic. The calculations for 2005 show widespread instances of exceeding the limits in the entire primary road network, especially in the inner city.
These investigations indicate that the two most problematic pollutants in Berlin are NO2 and PM10. Because of their physical effect, strict limit values for these substances must be upheld in the European Union and in Germany.
Effects
Nitrogen oxides are acidifiers. They are harmful to human health, cause damage to plants, buildings, and monuments, and contribute significantly to the excessive formation of ground level ozone and various noxious oxidants during summer heat waves.
Nitrogen oxides, especially nitrogen dioxide, lead to irritation of the mucus membranes of the respiratory passages in people and animals, and can increase the risk of infection (see Kühling 1986). Cell mutations have also been observed (BMUNR 1987). Various epidemiological studies have shown a correlation between the deterioration of the functions of the lungs, respiratory tract symptoms, and increased nitrogen dioxide levels (see Nowak et al. 1994).
Diesel soot is a major component of particulate matter (PM10) in motor vehicle exhaust. It is a carrier for polycyclic aromatic hydrocarbons (PAH), a carcinogen, but also on its own, it is a possible cause of lung and bladder cancer (see Kalker 1993). Moreover, such ultra-fine particulate as diesel soot, smaller than 0.1 µm, is suspected to increase the risk of cardiovascular disease.
Legal Stipulations and Limit Values
An evaluation of air pollution from motor vehicle traffic has only become concretely possible for immission control authorities since 1985, since the European Community, in the Directive of the Council of 7 March 1985 on Air Quality Standards for Nitrogen Dioxide (Directive 85/203/EWG), specified limits and goals for this pollutant. In addition, it stipulated that measurements be taken of concentrations of nitrogen dioxide on “canyon streets” and major intersections.
In 1996, due to a multiplicity of new findings regarding this and other air pollutants, “Directive 96/62/EG On Ambient Air Quality Assessment and Management (the so-called “Framework Directive “) was drafted and brought into force.
In this Directive, the Commission is called upon to submit, within a specified time period, so-called “subsidiary directives” stipulating limits and details for the measurement and assessment of a specified list of components.
Since then, four subsidiary directives have come into force:
- on July 19, 1999, Directive 99/30/EG, with limits for sulphur dioxide, particulate matter (PM10), nitrogen dioxide and lead;
- on December 13, 2000, Directive 2000/69/EG, with limits for benzene and carbon monoxide;
- on February 9, 2002, Directive 2002/3/EG, for comparing ozone at ground level to the data and level of excess over the limits; and
- on December 15, 2004, Directive 2004/107/EC, with limits for arsenic, cadmium, mercury, nickel and PAH.
Germany had two years to enact the first two subsidiary directives into national law, a deadline it missed substantially, as the Seventh Amendment to the Federal Immissions Protection Law (BImSchG), which addressed the first subsidiary directive, was not enacted until September 2002. The new Ozone Directive has now also been enacted into German law with the new 33rd Ordinance of the BImSchG.
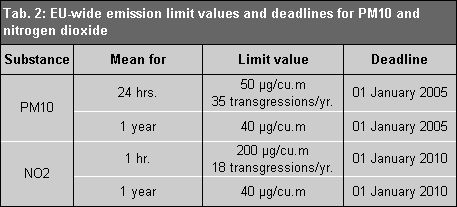
The core elements of the Air Quality Directives are the immission limit values, which are “to be attained within a given period and not to be exceeded once attained”. The pollution concentrations, and the time in which the limits must be met, are stipulated in the subsidiary directives, and in the 22nd Ordinance to the BImSchG (22nd BlmSchV).
Table 2 shows the stipulated limits for the two air pollutants which pose the greatest potential problem for Berlin: PM10 and nitrogen dioxide.