Immissions prognosis for 2020-2025, without additional measures (trend)
In order to develop a clean air plan, it is necessary to investigate how air quality will develop in the future without any additional measures. It is crucial in determining the required scope of further measures, which are geared towards the polluters, and at the same time are reasonable and effective. The years 2020 and 2025 were investigated, with the latter providing a long-term perspective. The Clean Air Plan includes all relevant source groups in the analysis of causes, trend prognosis and investigation of possible measures. The map contents presented here, however, focus on the main source of near-ground air pollution, motor vehicle traffic only.
Prognosis calculations were carried out for the years 2020 and 2025 (only in German). A complete immission prognosis comprises the following steps:
- estimating the existing pollution in the regional background, while also considering the large-scale development of emissions,
- forecasting the development of the population and other structural data regarding the urban and economic development of Berlin and the emissions to be expected for the entire city,
- forecasting traffic burden in the primary road network and the development of the vehicle fleet,
- modelling the urban background using predicted emission developments for Berlin’s pollutant sources and
- calculating immission levels along roads.
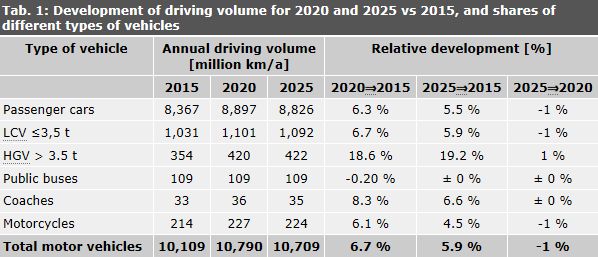
The prognosis of the development of emissions related to Berlin’s motor vehicle traffic is based on two types of assumptions. The first concerns the development of the driving volume for each vehicle group in Berlin and the second concerns the technical modernisation of the current vehicle fleet.
To predict driving volume development for the prognosis years of the Clean Air Plan, the overall traffic prognosis for Berlin for 2030 was adapted. This includes adjustments to the population development, employment data, school locations, retail space and changes in infrastructure, e.g. the status of parking management. The traffic model also incorporates new traffic resulting from additional land use for residential, small business and commercial purposes.
The traffic model used by the State of Berlin is an integrated model, which comprises motor vehicle traffic, public transport and bicycle traffic.