Climate Model Berlin - Analysis Maps 2005

Statistical Base

The application of numerical simulation models requires acquisition of basic data and of meteorological ancillary conditions in a territory extending beyond the actual investigation area. This is designed to assure that the model can “swing itself into place”, so as to be able to simulate conditions as realistically as possible at the margins of the actual project area (for the methodology of the FITNAH climate model used here, cf. (Methodology). Hence, the investigation area consists of two major components: the approx. 890 km² area of the city of Berlin, and an approx. 1650 km² area in the suburbs. (cf. Fig. 1).

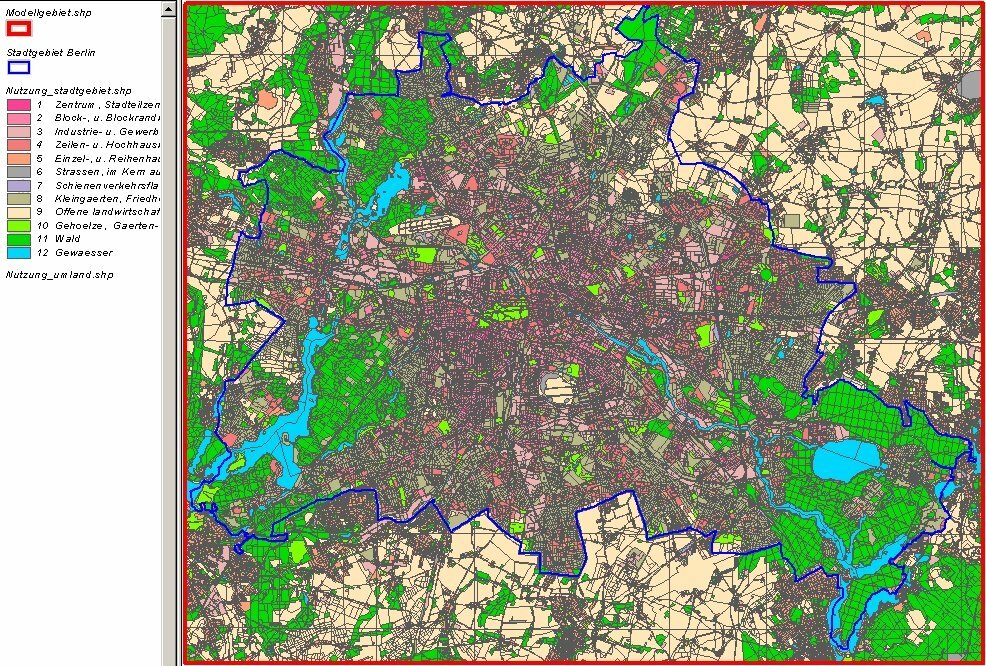
Fig. 1: Classification of the land use for the model application. A key with 12 use classes is used, adjusted to the requirements of the FITNAH model.

Only a few of the parameters used for the Berlin urban area were obtained especially for this project; for the most part, data bases developed over the years of work on the Environmental Atlas and for the Berlin ISU which are available for various evaluations and calculations. The Urban and Environmental Information System (ISU) of the Senate Department of Urban Development contains approx. 25,000 individual areas in a spatial reference system, which has been made available for the calculation of the climatic quanta in the ISU:

  • Land use. The data on land use show the status of year-end 2005 and are based on the evaluation of aerial photography, borough land use maps and additional documents for the Environmental Atlas (cf. Map 06.01 and Map 06.02, SenStadt 2008a). Some 30 types of use are distinguished.
  • Urban structural types (Map 06.07, SenStadt 2008b). A further improvement of this data was carried out via a factual database, which contains type-specific details on the heights of buildings and vegetal structures within the individual urban structural types.
  • Sealing (Map 01.02, SenStadt 2007).
  • A digital terrain elevation model (DGM5) was available for the downtown area and partially for the north and southeast of the city. For the remaining area, a DGM25 has been at hand.

From the preliminary work for the conversion of the European Union guideline to the ambient noise, a building file with elevation data (date 2005) has been used which contains all 550,000 buildings of the Automated Property Map (ALK) of the federal state of Berlin as well as 231,445 buildings of the federal state of Brandenburg within a distance of 3 km around Berlin.

The ALK, as the illustrative section of the so-called Property Register, shows not only the lots, but also the buildings in their precise size, including numbers of storeys, and is therefore well suited as an information base for the illustration of building structures (cf. Fig. 2).

Ausschnitt aus der Automatisierten Liegenschaftskarte

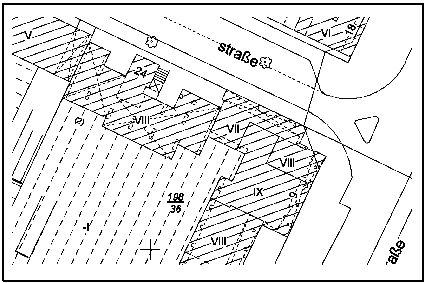
Fig. 2: Detail from the Automated Property Map (indication of numbers of storeys in Roman numerals).

With regard to the first application of the climate model 2003/2004, in this edition also air quality aspects have been taken into account with an extensive analysis. For that purpose, data of the traffic emission register 2005 of the Department of Health, Environment and consumer protection has been used (cf. SenGesUmV 2008).

The followings data bases were of use for the incorporation of the areas outside of Berlin:

  • ATKIS (Official Cartographic Information System). The map collection encompasses the first implementation step of the basic landscape model DLM 25/1. The basic data stock contains various types of object and attributes. The streets, paths, railroads, bodies of water and boundaries form a geometrically exact line structure of the landscape. It is filled out by the two-dimensional landscape elements, such as residential areas, etc.
  • The terrain altitudes were taken from the data stock of the CORINE Project. Corine stands for “Coordinated Recording of Information on the Environment,” and is a program established in 1985 by the Commission of the European Union to record environmental data.
Database and data flow for the application of the climate model FITNAH

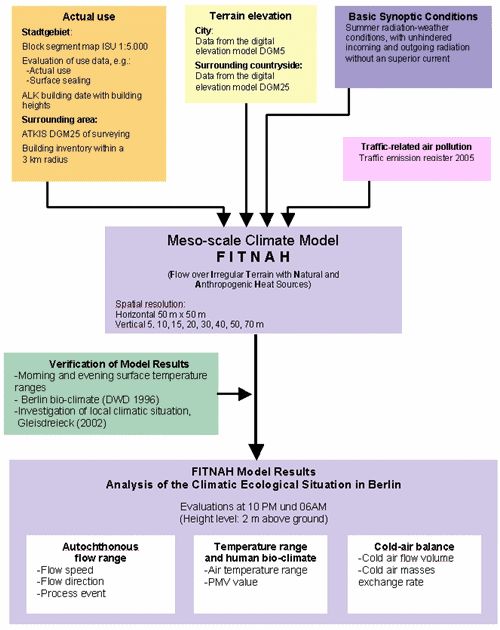
Fig. 3: Database and data flow for the application of the climate model FITNAH