In accordance with the requirements of the “Directive relating to the assessment and management of environmental noise”, the strategic noise maps present the noise situation using 5 dB intervals:
New
The Environmental Atlas maps are available in the new Map Application
Strategic Noise Maps 2022
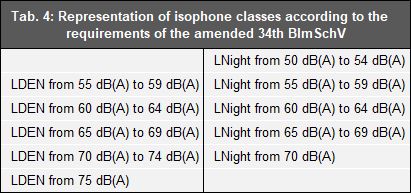
Tab. 4: Representation of isophone classes according to the requirements of the amended 34th BImSchV
Image: Umweltatlas Berlin
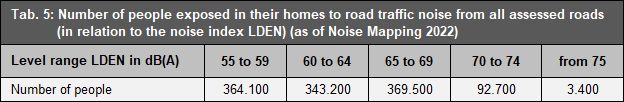
Tab. 5: Number of people exposed in their homes to road traffic noise from all assessed roads (in relation to the noise index LDEN) (as of Noise Mapping 2022)
Image: Umweltatlas Berlin
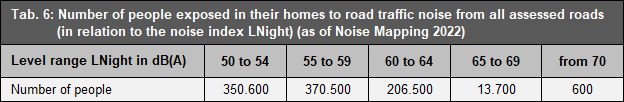
Tab. 6: Number of people exposed in their homes to road traffic noise from all assessed roads (in relation to the noise index LNight) (as of Noise Mapping 2022)
Image: Umweltatlas Berlin
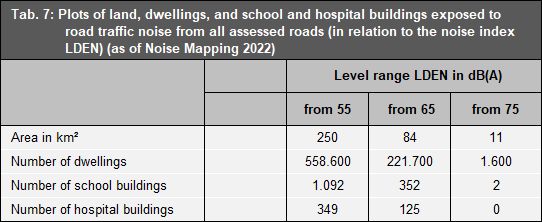
Tab. 7: Plots of land, dwellings, and school and hospital buildings exposed to road traffic noise from all roads assessed (as of Noise Mapping 2022)
Image: Umweltatlas Berlin
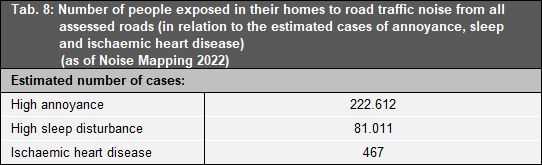
Tab. 8: Number of people exposed in their homes to road traffic noise from all assessed roads (in relation to the estimated cases of annoyance, sleep disturbance and ischaemic heart disease) (as of Noise Mapping 2022)
Image: Umweltatlas Berlin
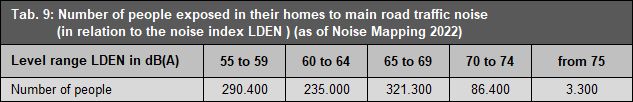
Tab. 9: Number of people exposed in their homes to main road traffic noise (in relation to the noise index LDEN) (as of Noise Mapping 2022)
Image: Umweltatlas Berlin
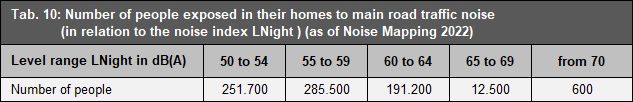
Tab. 10: Number of people exposed in their homes to main road traffic noise (in relation to the noise index LNight) (as of Noise Mapping 2022)
Image: Umweltatlas Berlin
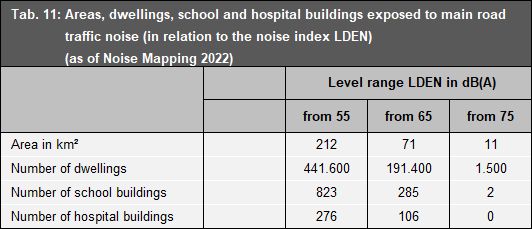
Tab. 11: Areas, dwellings, school and hospital buildings exposed to main road traffic noise (as of Noise Mapping 2022)
Image: Umweltatlas Berlin
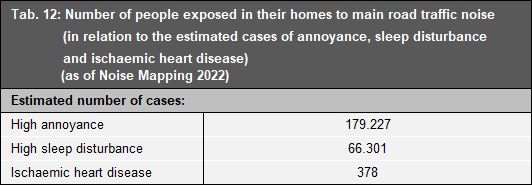
Tab. 12: Number of people exposed in their homes to main road traffic noise (in relation to the estimated cases of annoyance, sleep disturbance and ischaemic heart disease) (as of Noise Mapping 2022)
Image: Umweltatlas Berlin
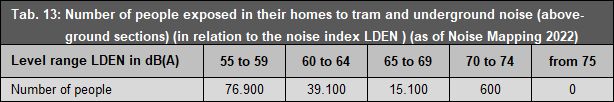
Tab. 13: Number of people exposed in their homes to tram and underground noise (above-ground sections) (in relation to the noise index LDEN) (as of Noise Mapping 2022)
Image: Umweltatlas Berlin
Tram and Underground Traffic
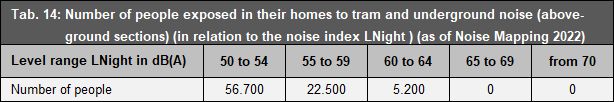
Tab. 14: Number of people exposed in their homes to tram and underground noise (above-ground sections) (in relation to the noise index LNight) (as of Noise Mapping 2022)
Image: Umweltatlas Berlin
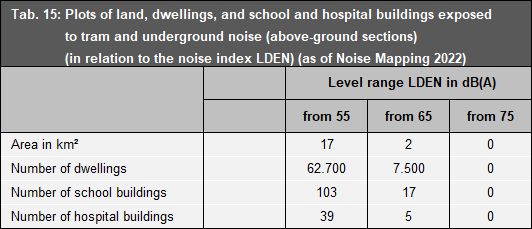
Tab. 15: Plots of land, dwellings, and school and hospital buildings exposed to tram and underground noise (above-ground sections) (in relation to the noise index LDEN) (as of Noise Mapping 2022)
Image: Umweltatlas Berlin
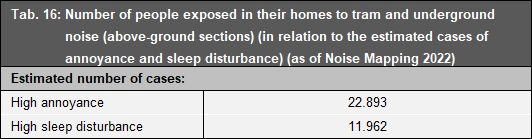
Tab. 16: Number of people exposed in their homes to tram and underground noise (above-ground sections) (in relation to the estimated cases of annoyance and sleep disturbance) (as of Noise Mapping 2022)
Image: Umweltatlas Berlin
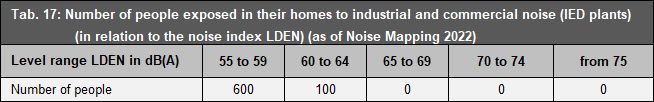
Tab. 17: Number of people exposed in their homes to industrial and commercial noise (IED plants) (in relation to the noise index LDEN) (as of Noise Mapping 2022)
Image: Umweltatlas Berlin
IED Plants
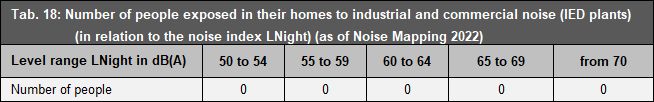
Tab. 18: Number of people exposed in their homes to industrial and commercial noise (IED plants) (in relation to the noise index LNight) (as of Noise Mapping 2022)
Image: Umweltatlas Berlin
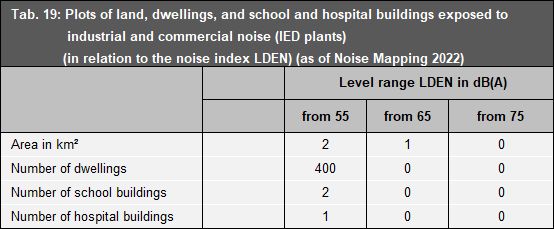
Tab. 19: Plots of land, dwellings, and school and hospital buildings exposed to industrial and commercial noise (IED plants) (in relation to the noise index LDEN) (as of Noise Mapping 2022)
Image: Umweltatlas Berlin
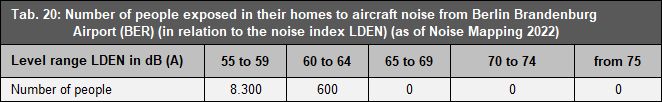
Tab. 20: Number of people exposed in their homes to aircraft noise from Berlin Brandenburg Airport (BER) (in relation to the noise index LDEN) (as of Noise Mapping 2022)
Image: Umweltatlas Berlin
Berlin Brandenburg Airport (BER)
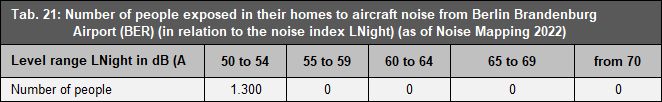
Tab. 21: Number of people exposed in their homes to aircraft noise from Berlin Brandenburg Airport (BER) (in relation to the noise index LNight) (as of Noise Mapping 2022)
Image: Umweltatlas Berlin
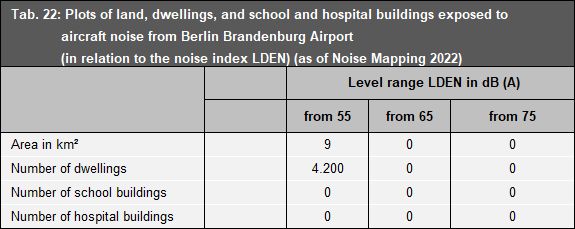
Tab. 22: Plots of land, dwellings, and school and hospital buildings exposed to aircraft noise from Berlin Brandenburg Airport (BER) (in relation to the noise index LDEN) (as of Noise Mapping 2022)
Image: Umweltatlas Berlin
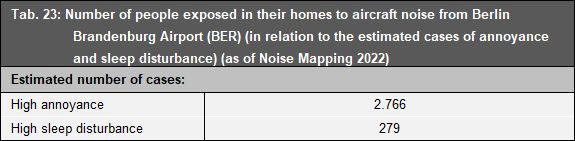
Tab. 23: Number of people exposed in their homes to aircraft noise from Berlin Brandenburg Airport (BER) (in relation to the estimated cases of annoyance and sleep disturbance) (as of Noise Mapping 2022)
Image: Umweltatlas Berlin
Environmental Atlas Contact
Berlin Senate Department for Urban Development, Building and Housing
Mrs. Haag