Groundwater Levels and Catchment Areas for Waterworks 1990

Maps

Vorschau

02.12.1 May 1976 (Relatively Lower Groundwater Levels)

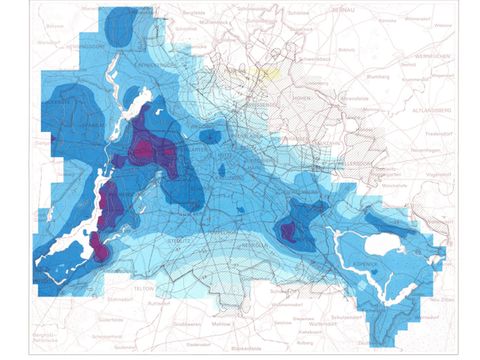
The year 1976 was characterised by low volumes of precipitation and comprehensive interventions in the groundwater balance. In combination with the maps of the same year, this map illustrates how the groundwater developed as a result of varying weather conditions, changing groundwater extraction measures and temporary groundwater retention during construction measures. 02.12.1 May 1976 (Relatively Lower Groundwater Levels)

Vorschau

02.12.2 May 1988 (Relatively Higher Groundwater Levels)

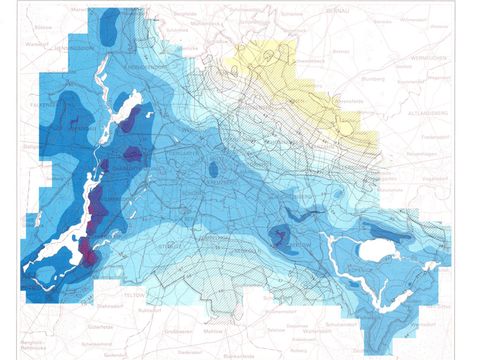
In 1988, the winter and spring months were mild and rainy. In addition, groundwater extraction and withdrawals were reduced by groundwater maintenance and restoration measures. In combination with the maps of the same year, this map illustrates the general groundwater development. 02.12.2 May 1988 (Relatively Higher Groundwater Levels)

Vorschau

02.12.3 May 1990

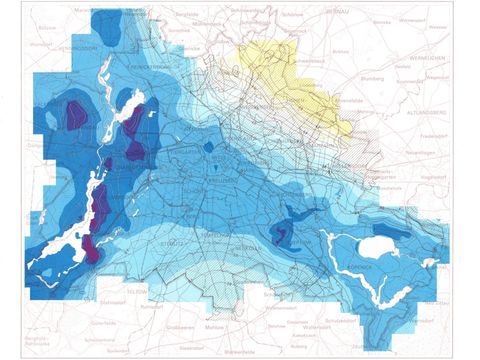
This map presents the differences in groundwater development for West and East Berlin in May 1990. In combination with the maps of the same year, it illustrates how the groundwater developed as a result of varying weather conditions, changing groundwater extraction measures and temporary groundwater retention during construction measures. 02.12.3 May 1990

Vorschau

02.12.4 Waterworks Groundwater Catchment Areas

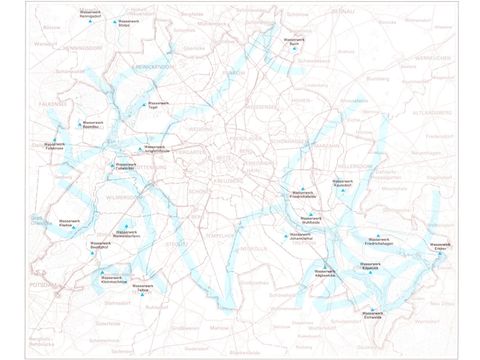
The boundaries of groundwater catchment areas result from geological conditions, groundwater dynamics and the receiving water system of an area. They are derived primarily from the direction of groundwater flow (perpendicular to the lines of equal observation well levels). Groundwater withdrawals by waterworks and other users modify the natural boundaries of groundwater catchment areas. 02.12.4 Waterworks Groundwater Catchment Areas