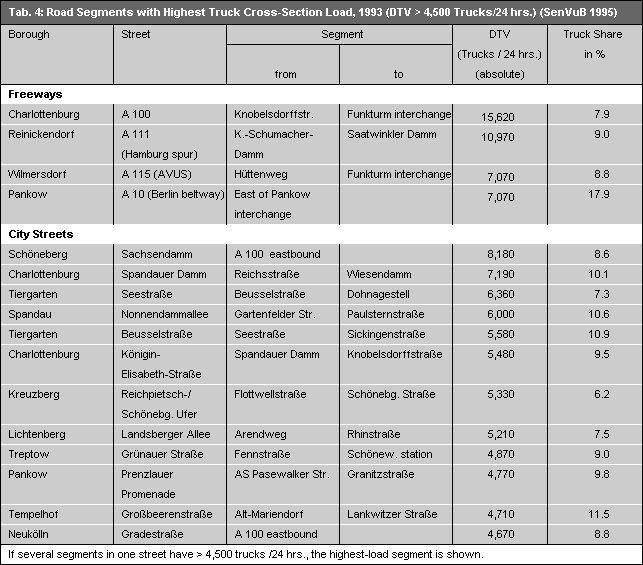
The segments with the highest weekday truck shares of motor-vehicle traffic are in the boroughs of Spandau (in 1993, 23.6 % at Freiheit between Pichelswerder Strasse and Klärwerkstrasse), Charlottenburg (12 % at Spandauer Damm between Reichstrasse and Bolivar Allee), Tiergarten (13.1 % at Siemensstrasse between Beusselstrasse and Stromstrasse) and Tempelhof (12.1 % at Gottlieb-Dunkel-Strasse between Ordensmeisterstrasse and Industriestrasse). All segments named are near industrial plants and/or utilities points (the fruit yard, sanitation department). The mean value for all city street measurement points was 5.5 % in 1993 (cf. SenVuB 1995).
Annual Distance Traveled and Traffic Volume
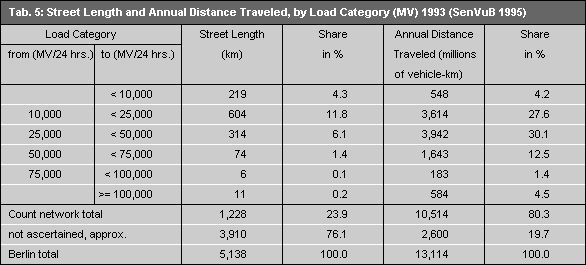
The annual distance traveled indicates the sum of kilometers which all motor vehicles in Berlin have traveled in a year.
In Table 5 the distances traveled are shown by load categories. From this, it is obvious that about 80 % of the entire distance traveled in Berlin is produced on approx. 24 % of the Berlin road network. This traffic concentration becomes especially clear when the load categories over 50,000 MVs/24 hrs. are considered. The segment share of these categories altogether totals only 1.7 % of the entire road network; however, 18.4 % of all distance traveled is produced on these streets.
The total annual distance traveled in 1993 in Berlin totaled approx. 13 billion km. In West Berlin alone, it increased from 6.1 to 7.8 billion kilometers per year during the period between 1980 and 1992. According to the results of traffic research, the share of the free-time traffic now exceeds the distance traveled for business and commuter purposes.
Because of the available data, longer-term statements on traffic volume development can be made only for the western boroughs of Berlin. A comparison of the traffic volumes from the traffic counts of the years 1971, 1980, 1985 and 1993 yields a 74 % increase in the 1993 traffic level over that of 1971.