Long-term Mean Precipitation Distribution 1981 - 2010

Map Description

The maps present the total precipitation averaged over the period from 1981 to 2010 according to water years (hydrological years, discharge years). A water year ends in October of the year in its title; it begins, however, in November of the year prior to that. The evaluations for the water years from 1981 to 2010 thus refer to the period from November 1980 to October 2010.

In addition, the totals for the winter and summer halves of the water year are also presented. Table 1 displays the evaluation periods.

Tab. 1: Evaluation periods for the long-term mean precipitation distribution, 1981-2010
Map Evaluation period Month Period
04.08.1 Annual precipitation November – October Nov. 1980 – Oct. 2010
04.08.2 Summer half May – October May 1981 – Oct. 2010
04.08.3 Winter half November – May Nov. 1980 – May 2010

For the period from 1981 to 2010, Berlin’s mean annual precipitation ranges between 543 mm and 625 mm, depending on the location. The mean precipitation for the urban area is 580 mm/a (cf. Table 2). Precipitation in the Grunewald area (575-605 mm) and on the Teltow (590-620 mm) and the Barnim plateaus (575-605 mm) are above average for the most part. In the Berlin glacial valley, which extends from the southeast to the northwest (545-575 mm), on the other hand, precipitation is below average, sometimes even dramatically so (Map 4.08.1).

Overall, similar characteristics have been observed for the summer half (Map 04.08.2) and the winter half (Map 04.08.3) of the year, albeit less pronounced. Especially in the winter half, the spatial variance is noticeably decreased. In the summer half, with an average of 322 mm, the mean precipitation is distinctly higher than in the winter half with an average of 259 mm.

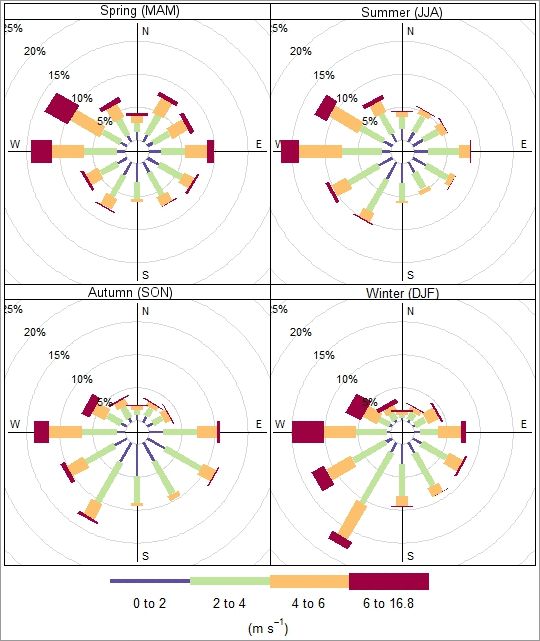
A correlation may be derived between the wind direction distribution predominant in the Berlin area and the influence of the city’s topography.

Figure 3 (SenUVK 2019) presents the mean wind direction distribution at the DWD station in Berlin-Tempelhof for all four seasons, differentiated by wind speed. Westerly winds of maritime and sometimes humid air occur frequently throughout the year. During the winter months, the influence of continental, often dry currents moving from the south to the east increases.

Fig. 3: Mean wind direction distribution at the Berlin-Tempelhof DWD station for all four seasons, differentiated by wind speed

Fig. 3: Mean wind direction distribution at the Berlin-Tempelhof DWD station for all four seasons, differentiated by wind speed

Fig. 4: Terrain elevations, Berlin

The aforementioned relationship between topography and the distribution of wind flows can be seen in the influence of the elevations in the area of the _Grunewaldhöhenzug_ (hill in the Grunewald) and the _Schäferberg_ (103.5 m). Here, precipitation is well above average, but drops by more than 30 mm towards the glacial valley. Shifting towards the east and beyond city boundaries, a continuous rise in precipitation becomes evident again.
The map characteristics do not provide any evidence that urban development impacts upon the precipitation distribution, as has been indicated by studies (cf. Introduction). Berlin’s development is still rather homogeneous in regard to height. This means that, on the one hand, there have been no artificial alterations of the soil roughness locally, alterations that could cause relief rainfalls. If the latter do occur, however, they are locally confined and rather spontaneous events that do not appear to have a noticeable impact on the long-term mean.

In addition to the described regional variation of precipitation distributions, local anomalies stand out (e.g. in the annual precipitation distribution (Map 04.08.1)). These appear as small-scale, concentric isolines or isosurfaces with precipitation totals that deviate greatly from their immediate surroundings. Examples are to be found at Schönefeld Airport (a lot drier) and in Berlin-Staaken (a lot wetter). These anomalies are due to the REGNIE data set used here. In the REGNIE method, the amount of precipitation measured at multiple stations are spatially interpolated using background fields. A measurement taken in the immediate vicinity of its precipitation measurement station has a very high weight attached to it. Therefore, precipitation station measurements that deviate significantly from their surroundings may distort the calculated precipitation distributions, which can have a local impact on the result.

Table 2 presents a selection of statistic characteristic values for the long-term precipitation distribution from 1981 to 2010 for the evaluation periods indicated. The evaluations refer to the area of Berlin excluding surrounding areas.

Tab. 2: Statistic characteristic values for the long-term precipitation distribution in Berlin, 1981-2010
Annual precipitation Summer half Winter half
Minimum [mm/a] 543 301 236
Maximum [mm/a] 625 348 277
Mean [mm/a] 580.1 321.6 258.5
Standard deviation [mm/a] 13.4 8.0 6.6

The Environmental Atlas evaluations of the long-term precipitation distribution from 1961 to 1990 were based on station-referenced precipitation measurement series provided by the DWD and other authorities. Processing and interpolating the data from the different stations was extremely onerous but necessary to be able to derive area-related precipitation distributions. With their REGNIE products, however, the DWD provides area-related precipitation data. This data forms the basis for the current update of the Environmental Atlas. Due to the different data bases and resulting differences in methodology, the current results and these of the previous edition of the Environmental Atlas can only be compared to a very limited extent.