The data for the calculation of the runoff quanta for the approx. 25,000 single areas of the ISU spatial reference system were provided by the Berlin City and Environment Information System (ISU).
The data on land use are based on the evaluation of aerial photography, borough land-use maps and additional documents for the Environmental Atlas (cf. Map 06.01, SenStadt 2005a and Map 06.02, SenStadt 2005b). Some thirty types of use have been distinguished. With the exception of single supplements, they represent the state of utilization as of the end of 2001.
The long-term mean values of precipitation for the series of years 1961 through 1990, showing the annual mean temperatures and the means for the summer semesters (May through October), were calculated from the measurements of 97 measuring stations of the Free University of Berlin and the German Meteorological Service (cf. Map 04.08, SenStadtUm 1994). The data from this model were calculated for the center-point coordinates of the block segments.
For the potential evaporation, long-term mean average values of the TURC evaporation, increased by 10%, were used. These were calculated from observations by climate stations in the Berlin area. For the municipal area, borough-referenced values between 610 and 630 mm/yr. and between 495 and 505 mm for the summer semester were assigned.
The degree of sealing determined for each block segment by evaluation of air and satellite photography, using the map of Berlin in a scale of 1: 4/5,000 and the city planning file at the beginning of the ‘90s, and continued in 2001 in the context of a key-area update. The data initially do not include the roadways (cf. Map 01.02, SenStadt 2004b). The data base distinguishes between the built-up sealed area (roof area) and the non-built-up sealed area (parking lots, walkways etc.). For the non-built-up sealed area, the proportions of various surface-cover types was also an important factor. The surface-cover types were grouped into four surface-cover classes (cf. Tab. 2), and specifically ascertained for individual structural types on test areas in the terrain, and then referenced to all block segments of the same structural type. In some cases, the surface-cover-class break-down for certain segments was ascertained from aerial photography, and thus diverged from the overall evaluation.
Details on the sealing degree of roadway areas were taken from statistics on roadways and their pavements from the Senate Building Department. The surface-cover types listed there were grouped into the above-mentioned surface-cover classes. Since these statistics only exist at the borough level, the sealing degree and surface-cover class distributions were assigned to all areas of each borough generally.
The soil-scientific data on the usable field capacity of the shallow-root zone (0-30 cm) and the usable field capacity of the deep-root zone (0-150 cm) were derived from the Berlin Soil Association Map (cf. Map 01.01) SenStadt 2005 in the context of an expert report (Aey 1993).
For the determination of the depths to water table, a model of the terrain altitudes based on the digitalization and following interpolation of approx. 85,000 individual data on area altitude (cf. Map 01.08, SenStadt 1998c) was first developed. Parallel to that, a model of the height of the groundwater surface was compiled from measurements at observation pipes of the State Groundwater Service obtained in the measurement operation of May 2002. The depth-to-water-table data used for the calculation of the runoff were then calculated from the difference model between the altitude model and the groundwater height model (cf. Map 02.07, SenStadt 2003) for the center-point coordinates of the block segments.
The area size is used for the calculation of runoff volumes. The area size of each block segment (without roadway areas) is available from the ISU. In addition, the estimated area size of the roadway surface, referenced to each single block segment, was indicated. For this purpose, available data on the area of roadways at the level of the statistical area were weighted for surface area and calculated for the segments.
The data on the sewage system were obtained from the Map Disposal of Rainwater and Sewage (cf. Map 02.09, SenStadt 2004a, 2004b), which has in recent years been updated to the situation of ca. 2001 and digitalized. The criterion was the existence of sewage lines for rainwater in the adjacent streets. The data is therefore initially independent of actual inflow of rainwater. The map only states whether the block area is connected to the sewage system at all. It is to be assumed that some highly sealed areas (mostly industrial and commercial areas) pass their rainwater on via the public sewage system or private pipes, but that no information is available on this.
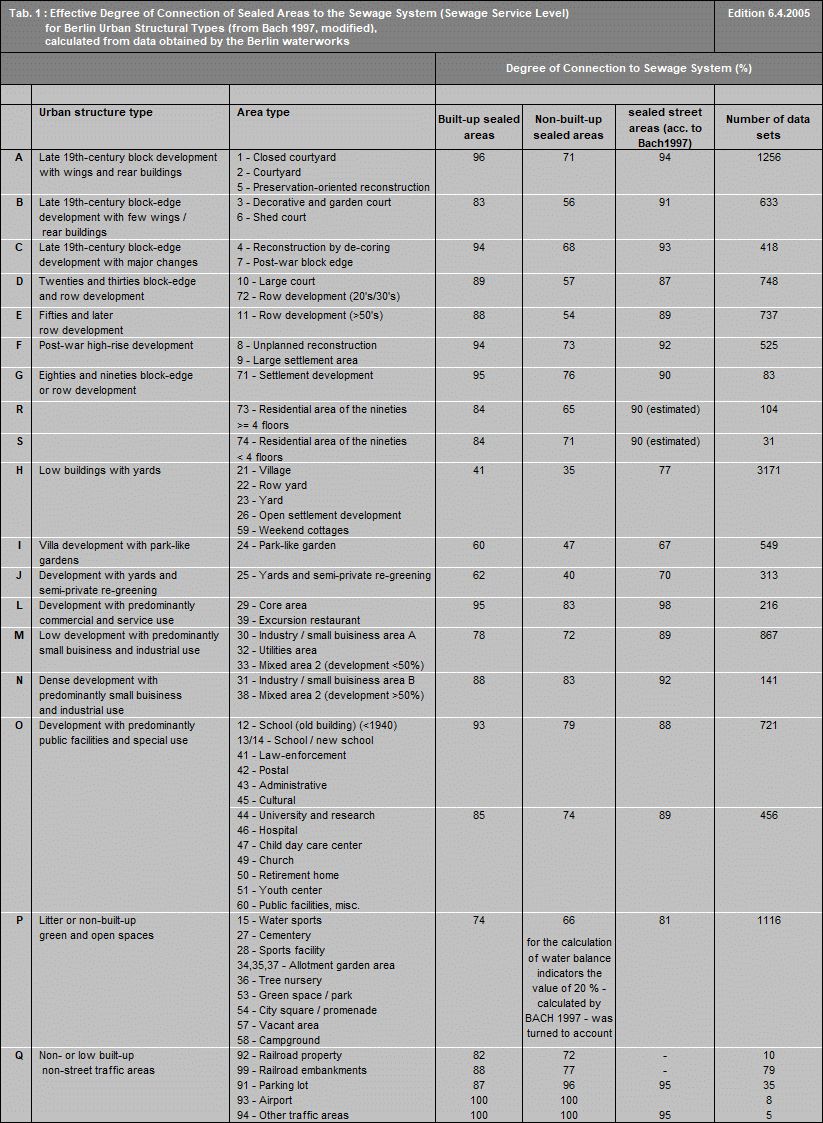
However, the map does not yet state the extent to which the water derived from the built-up or sealed areas is actually passed on. For this purpose, special investigations have been necessary. For an estimate of the actual degree of connection to the sewage system, one new data source had become available since the first application of the model to Berlin (SenStadtUmTech 1999s). In the context of the restructuring of the sewage-fee schedule by the Berlin Waterworks (BWB), a property-specific survey of sealed areas was carried out, which distinguished between connected and non-connected sealed areas. Its purpose was to determine the costs of rainwater disposal, largely according to the principle of causality. These data were also recorded graphically and submitted to the Senate Department, aggregated to the data surfaces of the spatial reference system of the ISU. The evaluation of these data showed, however, that the BWB’s graphic recording had not been carried out everywhere. For this reason, the original data could not be used directly for the water balance model. Based on the consideration that the degree of connection is closely related to the age and structure of the buildings, general values were therefore determining arithmetically for each structural type from the BWB data and the map of building structures (cf. Map 06.07, SenStadt 2005c), which covers all areas, and assigned to all single blocks connected to the sewage system. The results are summarized in Tab. 1. A comparison of the values with those ascertained by BACH 1977 yielded good agreement. Only in one case, that of the Urban Structural Type P (non- or little built-up green and open areas), does the degree of connection of the non-built-up sealed surfaces differ strongly from the value determined by BACH – 66%, as opposed to his 20. Since the analysis of the BWB database had shown that it was especially in these areas that the non-built-up sealed areas had been assessed insufficiently or not at all, BACH’s value was used for this structural type. The actual degrees of sewage connection of roadway areas were also assigned as per BACH, since these areas had not been included in the BWB survey.