The analysis of the stock of green space covered all green spaces in the area of the city with recreational qualities.
This analysis includes the green spaces and playgrounds presented in the Green-Space Information System (GRIS). It also involves both green spaces created as part of compensatory measures, such as the Rudow-Altglienicke landscape park, and areas maintained by Grün Berlin GmbH, such as the Britzer Garten and the Gärten der Welt in Marzahn. The grounds of the “Prussian Palaces and Gardens Foundation Berlin-Brandenburg”, such as the Schlosspark Charlottenburg are part of this, too. Berlin’s forest areas (open space type within the meaning of Urban Structure, Map 06.08) are also relevant in this context, as they provide at least some of the qualities that near-residential green spaces offer.
The Botanischer Garten, Zoologischer Garten and Tierpark Friedrichsfelde are not included in this availability analysis, as they are neither freely accessible public green spaces, nor are they public green spaces with affordable entrance fees.
The following criteria were used to ascertain green spaces with recreational qualities:
-
Area size
Facilities for near-residential recreation must have a minimum size of 0.5 ha, to make type-specific use possible. For green spaces bisected by streets, the resulting segments are considered only if one of them is larger than 0.5 ha. However, smaller areas can also be included, provided that they directly border on other green spaces, and are thus located in the context of the green network structure.
Moreover, it is assumed that green spaces, which are greater than 10 ha and are assigned to the “near-development” category are needed and visited by residents living nearby, in the manner of near-residential use. Therefore, for the purposes of this analysis, these larger facilities have also been assigned intake areas, and calculated accordingly. -
Accessibility
Unhindered accessibility to the green space must be guaranteed. Obstacles include railway lines, large bodies of water, and motorways. -
Environmental stresses
Noise pollution and air pollution diminish the recreational value of spending time outside. Since detailed measurements and/or prepared data regarding the air quality in green spaces was not available at the time of compilation, the pollution factor is limited here to the element of traffic noise.
For green and open spaces, German Industrial Standard (DIN) 18005, 5.87, Sound Protection and Urban Development for Urban Development Planning, specifies a limit of 55 dB (A). With free acoustic propagation, this limit can be reached on a city street with a speed limit of 50 km/h even at a vehicle load of 2,000 motor vehicles per day. Main thoroughfares are, as a rule, burdened with far more than 10,000 motor vehicles per day (cf. Environmental Atlas Map Traffic Volumes, 07.01, 2014). This corresponds to a noise pollution of more than 60 dB (A), and frequently more than 70 dB (A). Patchy vegetation in green spaces provides no noise buffer. A reduction of the noise can be ascertained solely at increasing distance from the source of the noise. Due to the location of many green spaces on heavily travelled streets, a large number must be considered heavily noise-polluted, and would therefore be classified as unsuitable for recreation. As a minimum requirement, it was stipulated that at least a part of the open space had to be unaffected by major environmental stresses. This criterion was further specified to indicate that an open space on a heavily-travelled street, with a noise level of more than 70 dB (A), would only be classed as suitable for recreation if it had a minimum depth of 100 m from the street, or a minimum size of more than 1 ha. Minimum size and/or depth should guarantee that a visit to the open space would be possible at a distance from the street.
Ascertainment of Intake Areas
Each green space with recreational qualities is assigned an intake area because Berlin’s standard values for the “availability of green space” define a combination of area size (m²/inh.) and accessibility (max 500m). The intake areas must be characterised by residential use (population threshold: 10 inh./ha). Green spaces in the neighbouring State of Brandenburg are not taken into account.
For smaller facilities, the centre is chosen as the point of origin of the radius; for larger spaces, the entrance area was used (approx. 100 m inside the open space). The intake area calculated for near-residential green space, for a distance of between 300 and a maximum of 500 m around that green space, only takes complete blocks and block segments into account.
Since the accessibility of a green space can be reduced by existing barriers, these will be addressed next. Barriers include e.g. rivers and canals, railroad lines, airports and motorways. If such barriers exist around a green space, the intake area is corrected.
Forest areas are also assigned an intake area because it is assumed that the edges of forests can to some extent assume the functions of a near-residential open space. Inhabited blocks in an intake area of 500 m from forest areas are categorised as having green space available in the city of Berlin.
Recreational use of agricultural areas is possible only to a limited degree, and only in some parts of the area; however, in the Berlin portion of the Barnim region, the areas accessible by footpath are included in the assessment. For this recreational area, the agricultural segments, including fields, meadows and pastures, are part of the park landscape.
Calculation of the Degree of Availability
According to the standard value or benchmark applicable in Berlin, the availability of public green spaces to the population at a level of 6 m² or more of near-residential open space per inhabitant is considered sufficient. In a quantitative analysis step, the green space available in the respective intake area (in m²) is expressed in relation to the number of inhabitants in the area. The resulting ratio (m² of green space per inhabitant) provides information on the public green space available per person for the intake area in question. This value (m² of green space per inhabitant) is then categorised into four levels: good availability (standard value is met), reduced availability (standard value is met by 50 per cent and more), poor availability (standard value is met by less than 50 per cent) and no availability (less than 0.1 m² per inhabitant) (cf. Landschaftsprogramm Artenschutzprogramm – Begründung und Erläuterung [Landscape programme protection of species programme – explanation and commentary], SenStadtUm 2016, p.91).
For the calculation, all blocks are included in which more than ten inhabitants live per hectare. This so-called population threshold is established for the planning process to ensure that the automated analysis also considers the population living in areas with structure types with predominantly commercial, services, trades and industry, and those with “other uses”, without however including individuals, those living in industrial areas for caretaking or security purposes. In this way, more inhabited blocks can be included, especially in inner-city locations with key metropolitan use types, or mixed-use areas (cf. Figure 2).
Provision with Private Green Space
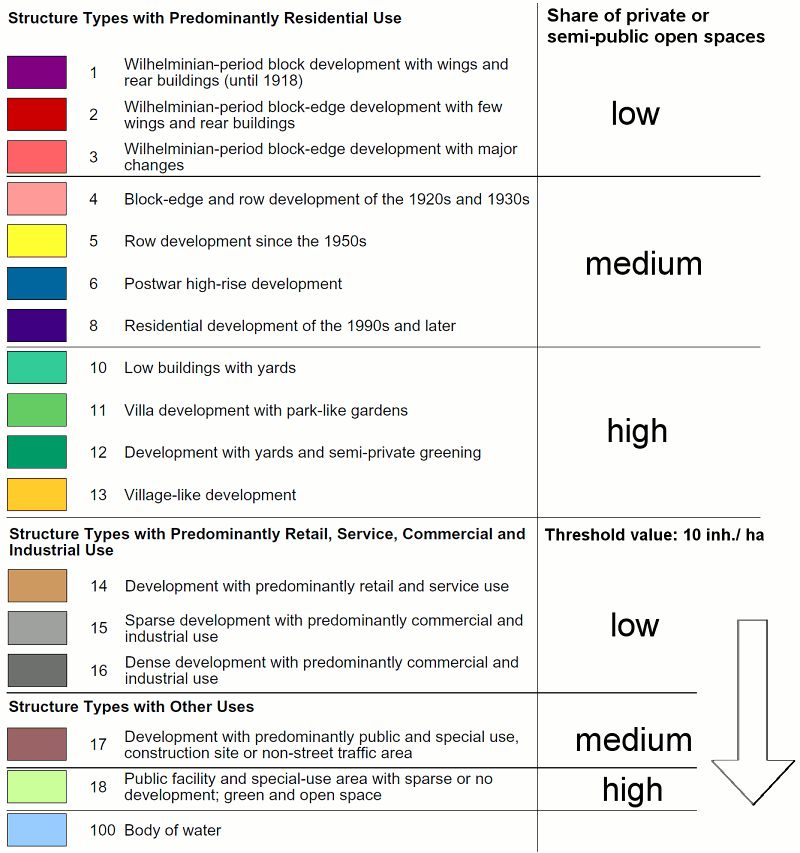
Private and semi-public areas can compensate for a lack of public green space. For this reason, the structure of residential buildings is used to determine the overall availability of green space: it is an indicator for the supply of private open spaces. Single-family housing developments, for example, have yards. In the block edge development of the Wilhelminian period, on the other hand, it is difficult to spend time in semi-private green spaces, other than in courtyards or on balconies. In order to ascertain not only the availability of public green areas to the population, but also that of private green/ open space, the urban structure recorded in the Environmental Atlas (cf. Statistical Base) was divided into three structure type categories, each assigned different proportions of private open space (high – medium – low, cf. map legend). Examples of these respective types include single-family home areas, areas with row-house developments, and in contrast to these, the inner city residential blocks of the Wilhelminian period.
Deduction of the Housing Type
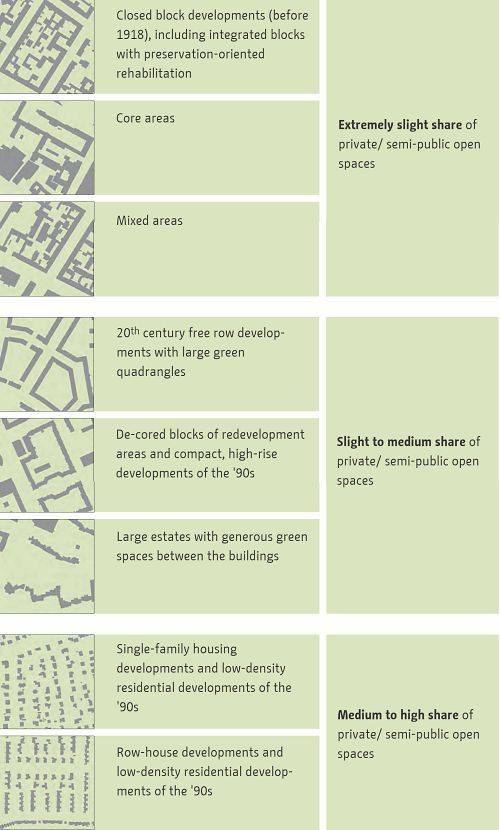
The building structure is examined as an indicator for the available share of private open space. Areas with different building structures, but with comparable shares of private/semi-public open spaces, are lumped together, and classified into three categories (cf. Fig. 1):
-
Extremely slight share of private/ semi-public open spaces
This involves predominantly areas of closed block development (before 1918), including all preservation-oriented reconstructed blocks integrated into this building structure. In addition, core and mixed areas are counted in this category. -
Slight to medium share of private/ semi-public open spaces
All building structures which display large quadrangles or strips of green space (development from the ‘20s and ‘30s and/or from the ‘50s and ‘60s), and the large estates with generous green spaces between the buildings belong to this category. Furthermore, the redeveloped apartment blocks of the ‘60s and beyond also include closed block development which was decored completely, and thus has larger open spaces. The compact, high-rise developments of the ‘90s are also included here. -
Medium to high share of private/ semi-public open spaces
This category includes all open development (for instance single-family or row-house development), and also the low density single-family housing developments of the ’90s. to a large extent, the buildings have their own gardens, so that the share of private green space is very high.