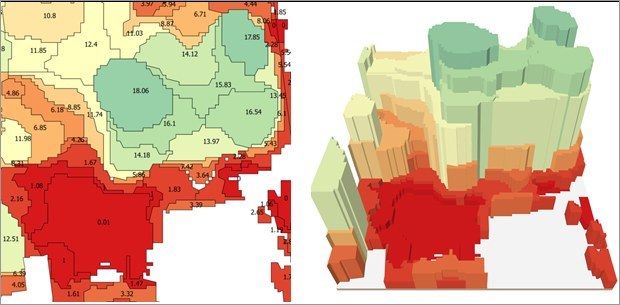
The data of the Environmental Atlas Map “Vegetation Heights” (06.10.2 SenStadtWohn 2020) forms the basis for calculating the green volume number for all ISU5 block (segment) areas and road areas (Spatial Reference, Environmental Atlas 2020). It contains all vegetation objects in the State of Berlin indicating their mean vegetation height (cf. Figure 1). The process for determining vegetation heights is based on an elaborate workflow, which the associated project report discusses in detail (SenStadtWohn 2021, only in German).
Both digital colour infrared orthophotos obtained during an aerial photography flight in August 2020 and a variety of digital surface models (cf. SenStadtWohn 2021, Statistical Base) were used to analyse the green volume.
Rather than creating a 3D canopy model, a simple cylinder graph was employed (cf. Figure 1). As a result, the green volume of trees has generally been somewhat overestimated.