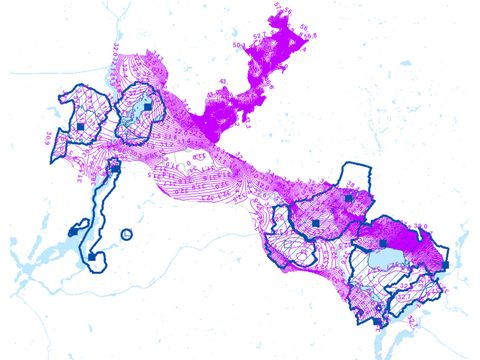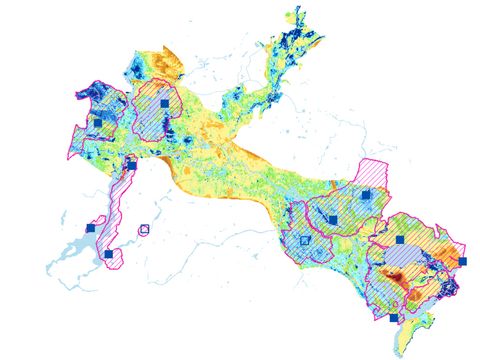
Image: Umweltatlas Berlin
02.20.1 Expected Mean Highest Groundwater Level (EMHGL)
The Groundwater Levels map illustrates the expected mean highest groundwater levels represented by isolines of equal height in metres above sea level (NHN). The distance between the lines is 0.1 m. The map therefore shows the groundwater surface for the EMHGL of the main aquifer, which is predominantly unconfined in this area, and its piezometric surface where it is confined. 02.20.1 Expected Mean Highest Groundwater Level (EMHGL)

