The degree of sealing was derived by different methods because of the different statistical data available in West and East Berlin.
West Berlin
The 1985 Environmental Atlas contained a map of sealing for West Berlin prepared by the Institute for Ecology of the TU (Technical University) in 1985 (SenStadtUm 1985). It shows the estimated degree of sealing at the level of housing blocks based on aerial photography taken in 1979.
An expert opinion for the updating and extension of the map was made in 1988 (AGU 1988). The goal was a complete and new determination of sealing and the entering of this data into the Environmental Information System of the Berlin Department of Urban Development and Environmental Protection. The degree of sealing of referenced areas in the Environmental Information System was determined by analysis of satellite photography. These referenced areas correspond to statistical blocks, but when there were different uses within a statistical block, the statistical blocks were further divided into uniform-use block segments. They form the Spatial Reference System in the Environmental Information System (digital surface map 1:50,000) and are illustrated with their uses in Maps 06.01 and 06.02 (SenStadtUm 1995).
The land use categories Forest and Agriculture were assigned an assumed degree of sealing of 1% and 2% respectively; ruderal, 7%; and parks, 10%. The analysis was thus concentrated on 10,000 areas relevant for sealing, which made up about 50% of West Berlin.
The degree of sealing of the referenced areas was initially determined by an interpretation of Landsat-TM satellite photos made in 1985 and 1988. Satellite photos were calibrated and classified into a ten point scale of sealing on the basis of test areas with known sealing degrees from maps produced on location. A color slide was published as a provisional result. It represented the sealing classes for 30 meter by 30 meter grids. The digital land map was then overlaid; the number of elemental areas separated by sealing class for each block segment was counted. Then the degree of sealing in percentage for each block segment was calculated.
A comparison of values determined by satellite photo interpretation and the values given by mapping of test areas showed only minimal average deviances. Deviances determined by a plausibility control were corrected with the aid of aerial photographs in order to achieve higher precision.
These data were updated in 1991 by comparison with aerial photographs taken in 1990.
East Berlin
A degree of sealing for each block segment in East Berlin was also determined.
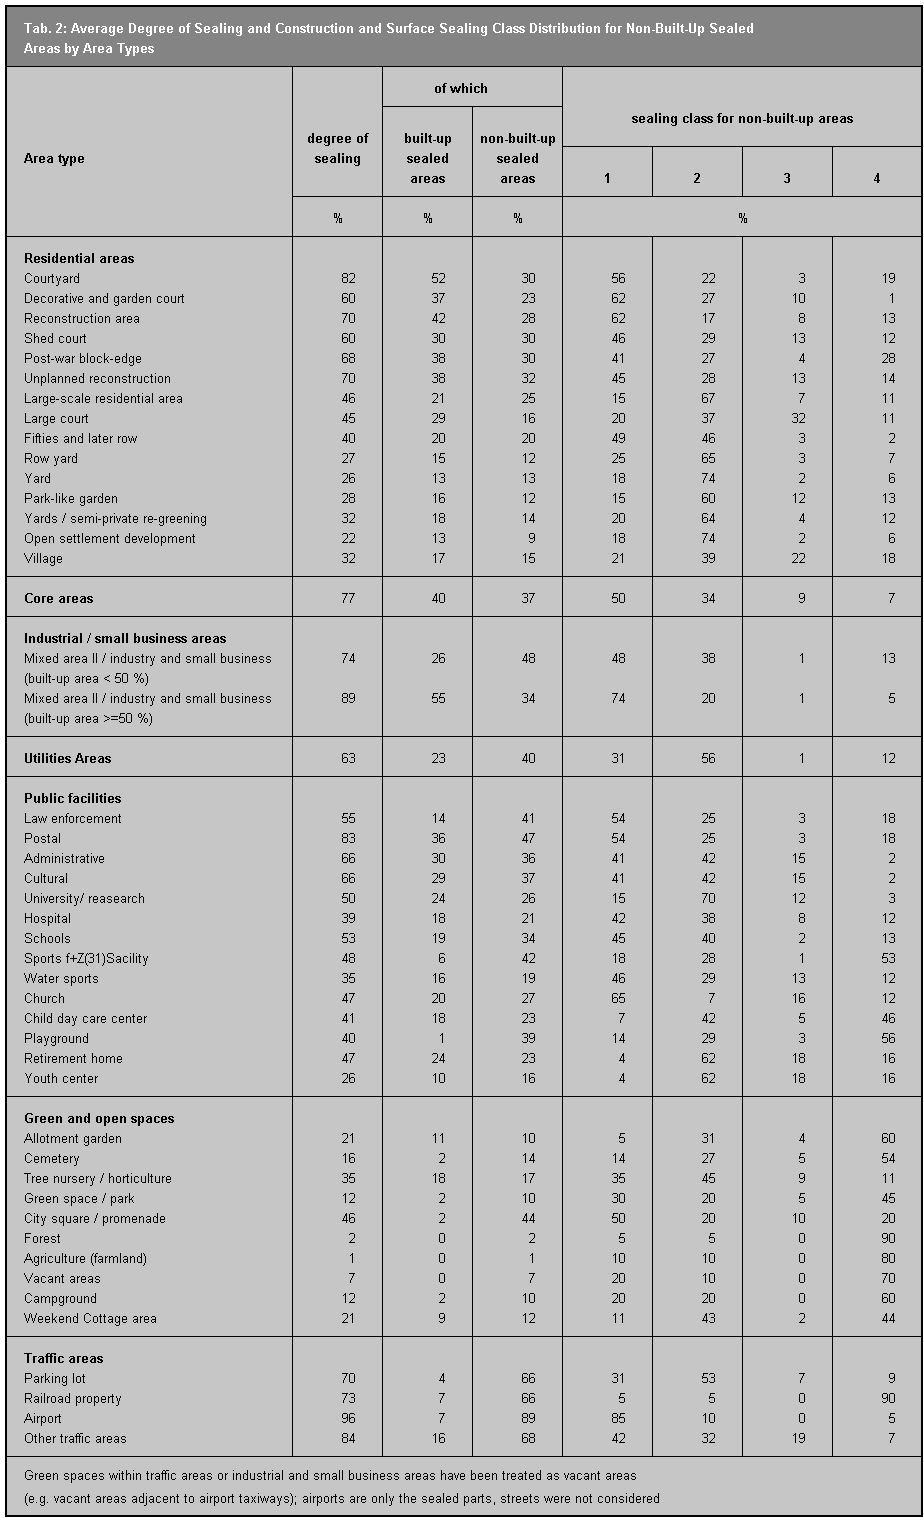
The easily recognizable degree of built-up development, in scale of 1:5,000, was initially estimated in percentage of total area. If old maps were used, the degree of built-up area was corrected with current aerial photographs, if necessary. The degree of sealing of a surface is determined by the components “degree of built-up development” and “other sealing” (non-built-up sealing). Non-built-up sealed surfaces include roads, parking places, loading and storage areas, etc.. The non-built-up sealed surfaces were also estimated in percent of total surface by interpretation of aerial photographs. Great difficulty was encountered in estimating the degree of sealing (and the non-built-up sealed surfaces themselves) in the dense interior courtyards dating from the late 19th century. The difficulty was caused by the shadow-effect of buildings and trees in the 1:6,000 scale aerial photographs. This diffused the view of the courtyard surfaces. Average values for this type of surface were applied in these cases.
A degree of sealing was determined by adding to the already determined degree of built-up surfaces. The degree of built-up surface is the more precisely determinable size. Degree of sealing values thus tend to be more precise when the degree of built-up surface is high.
Degrees of sealing were assigned to certain minimally-sealed surfaces, like parks and green spaces, only when they deviated from the general average.
A certain number of construction areas were mapped in East Berlin. Their condition at the time of survey did not allow information about their future type and thus their future degree of sealing. A category of “Indeterminable Degree of Sealing” was introduced for such cases.
The degree of sealing for streets is not shown in the map because the Spatial Reference System of the Environmental Information System only registers statistical blocks, but not streets themselves.
It was necessary in some cases to conduct a redetermination of non-built-up sealed surfaces. The satellite photo classification did not allow a differentiation between non-sealed surfaces without vegetation and sealed surfaces. The maintenance of a uniform classification did not enable these surfaces to be differentiated in the interpretation of aerial photography either. Vegetation-free areas such as beaches, dunes and barren lots were later classified as non-sealed surfaces.
Other vegetation-free (sub)areas, like stamped earth or gravel surfaces on railroad land, have a certain water permeability. They were initially classified as sealed. However, they should not be assigned a 100% degree of sealing, but only 40%. A reduction of the degree of sealing was thus calculated afterwards. This primarily concerned railroad surfaces having large areas covered with crushed stone; and industrial, small business and utilities areas. They have large areas of undeveloped surface used for storage. These reductions caused no great changes in the total map. Those statistical block segments whose degree of sealing was changed did not usually make up the entire area of the surfaces described above, but rather were carried in the calculations according to the proportions of their area.
Surface Sealing Classes
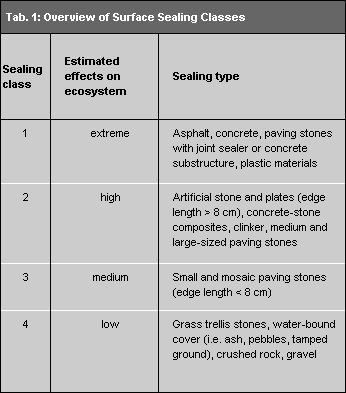
Several viewpoints are imaginable for surveying the effects of sealing on the ecosystem as differentiatedly as possible. Climatic effects, for example, are better interpreted if it is known whether the sealed surface is built-up or non-built-up and how high built-up portions are. The observation of effects on groundwater recharge and the run-off behavior of precipitation leads to the conclusion that not all artificial surface sealers have the same ecological properties. A widely-spaced mosaic of flagstones, for example, is much more water permeable than a concrete surface. A parking place laid with grass-trellis stones has a different micro-climate effect than an asphalt parking place.
These considerations have already been taken into account in the interpretation of data for this map. Four surface sealing classes were formulated, each with different effects on the ecosystem (see Table 1).


