Future Climatic Change and Thermal Load 2008

Statistical Base

The Urban Bio-Climate Model UBIKLIM

The atmosphere and hence the climate are part of the environment with which the human organism must constantly deal in order to maintain a balance of life functions and thus of human health. The required adaptation performance can be calculated from human heat budget models (VDI 1998), which objectively ascertain the connection between human beings and the atmosphere, both qualitatively and quantitatively. They take into account not only the air temperature, but also wind, humidity and solar radiation conditions, as well as the activity and clothing of the people. The DWD uses the Klima-Michel Model (Jendritzky et al. 1990). It is based on Fanger’s Comfort Equation (1972), including a correction by Gagge et al. (1986) that improves its ability to account for hot and humid conditions. It combines all quanta relevant for the human heat budget, and provides a statement about the average subjective feeling of humans (comfort, thermal load, cold stress). The theoretical person thus assessed is named “Michel” – an average male, 35 years old, 1.75 m in height, and 75 kg in weight.

Perceived Temperature, measured in °C, is used to describe thermal sensation (Staiger et al.1997). It compares the actually existing conditions found with the temperature that should prevail in a standard environment in order to create an identical feeling of warmth, comfort or coolness. It is assumed that clothing always varies on a scale between light in summer and heavier in winter, so that a person always feels as comfortable as possible. In Table 1, the Perceived Temperatures are assigned to human thermal sensation, and to the respective load stages.

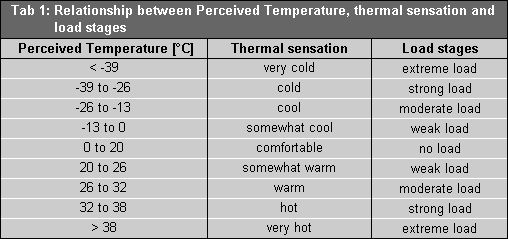
Tab. 1: Relationship between Perceived Temperature, thermal sensation and load stages

Tab. 1: Relationship between Perceived Temperature, thermal sensation and load stages

Since the possibilities for adaptation are rather limited under warm or hot conditions, and relief can only be obtained by moving to cooler surroundings (in extreme cases, to air-conditioned rooms), and in addition, since cities are subject to greater thermal load than the surrounding countryside, the heat or thermal load share of the bio-climate is of particular significance with relevance to human feelings of well-being, and in some cases, to physical health.

UBIKLIM uses the aforementioned Klima-Michel Model and helps to identify local differences in bio-climate, and evaluate Perceived Temperature as per Directive 3787 Sheet 2 (VDI 2008).

In order to reference not only the local municipal situation, but also the regional bio-climate, on the basis of which a connection to the climate scenarios of the future can then also be created, it has been necessary to extend the urban bio-climate model to a “combined urban bio-climate model” (see further explanations in the chapter on Methodology).

Use of Land Use Data

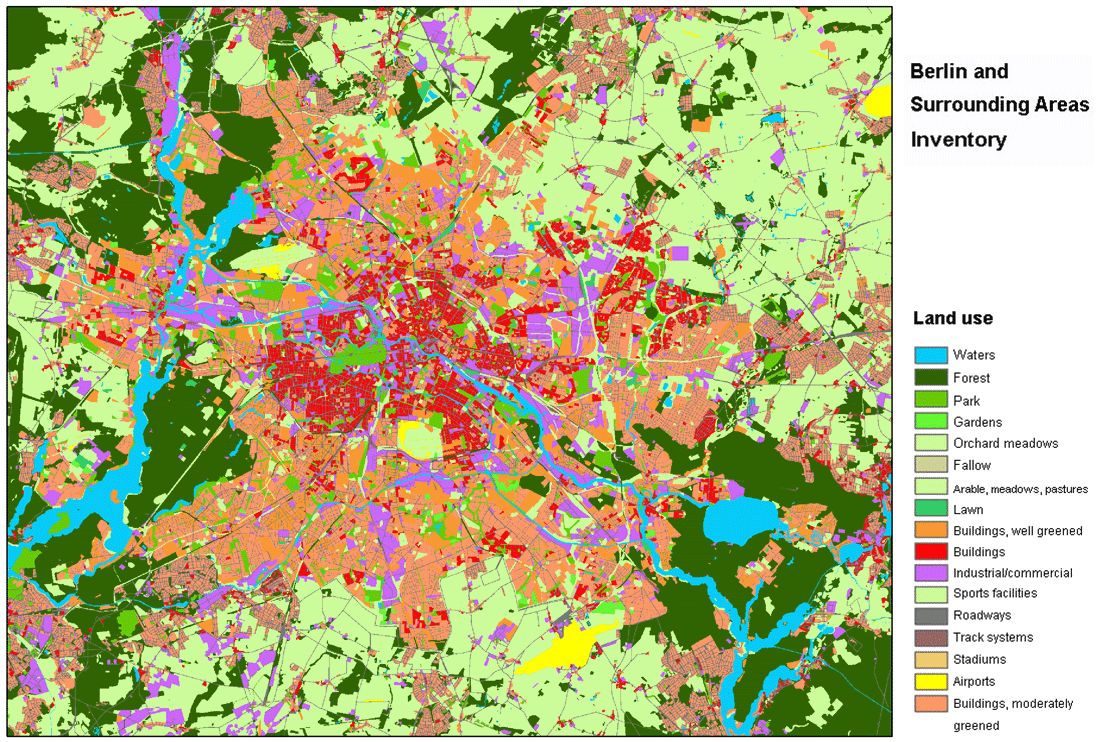
The application of simulation models requires a spatial survey of land use data and basic meteorological conditions extending beyond the area under investigation. The examination area therefore consists of the municipal area of Berlin, with approx. 890 sq. km, and a section of the surrounding areas, of approx. 850 sq. km. It thus encompasses an area of 46.1 × 38.0 km (see Fig. 2).

Fig. 2: Classification of land use for the application of the model. A legend with 17 use classes is used, which is adapted to the requirements of the UBIKLIM model

The data are provided using a grid of 25 m x 25 m, resulting in approx. 2,800,000 segments altogether. The parameters used for the municipal area of Berlin were taken from the data held by the City and Environment Information System (ISU) of the Senate Department for Urban Development, which is available for various evaluations and calculations. It contains approx. 25,000 segments in a spatial reference system which had to be converted to a regular grid for the UBIKLIM simulations:

  • Land use The land use data show the state of use at the end of 2005, and are based on an evaluation of aerial photography, borough land use maps, on-site examinations and additional documents for the Environmental Atlas (see Maps 06.01 and 06.02, SenStadt 2008a). Approx. 30 use types are distinguished.
  • Urban structural types (Map 06.07, SenStadt 2008 b). The data were further improved via the ISU use file, which includes type-specific information on the height of buildings and on vegetation structures within each urban structural type.
  • Soil sealing (Map 01.02, SenStadt 2007).

The preliminary work for the implementation of the EU Directive on Ambient Noise provided a file of buildings including height data, which could be fed in; it contains data as of 2005 on the 550,000 buildings in the automated property map (ALK) of the State of Berlin, as well as on 231,445 buildings in Brandenburg in a ring 3 km wide around the municipal area.

The ALK map, the illustrative section of the so-called property register, shows not only the property boundaries, but also the buildings including the number of storeys, with sharp precision, and is therefore suitable as basic information on building structures (see Map 4.10., Fig. 2).

With regard to the integration of the ALK data in the evaluation process, it must be taken into account that facilities in railway areas urban rail (S-Bahn) stations, buildings in industrial and commercial areas, and summer cottages in allotment gardens are not always recorded.

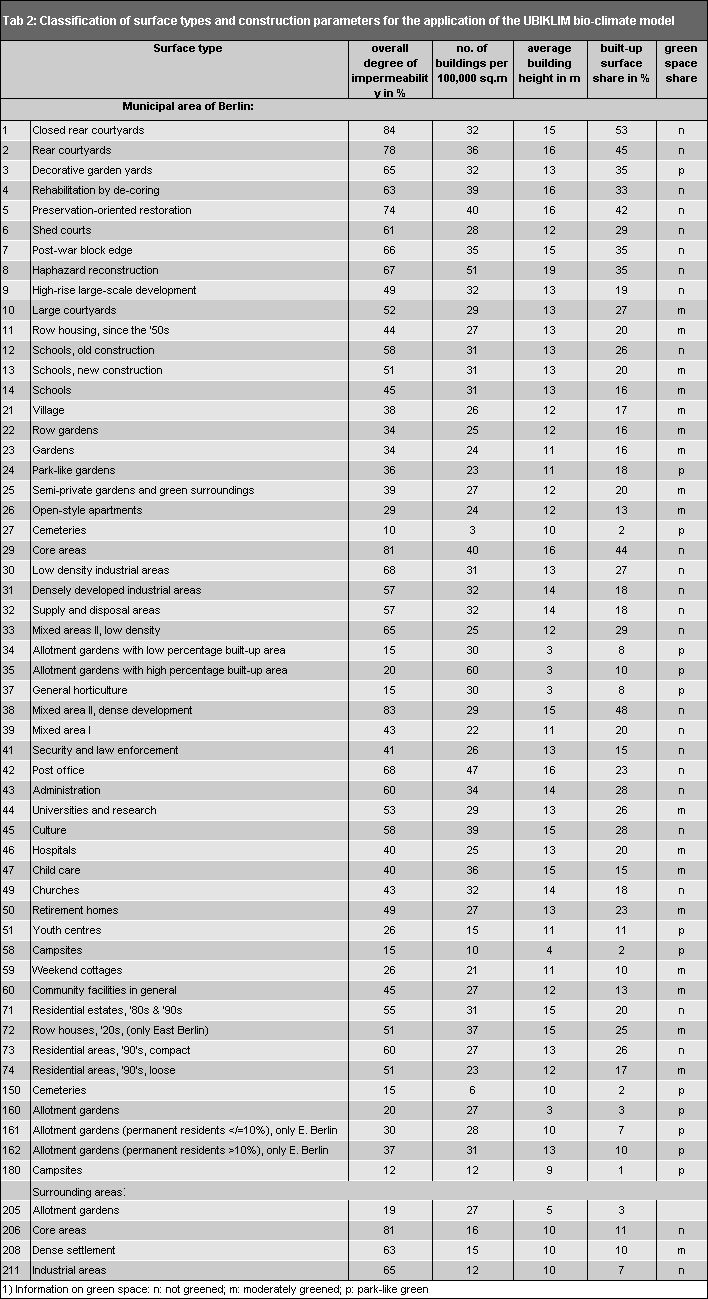
Tab. 2: Classification of surface types and construction parameters for the application of the UBIKLIM bio-climate model

Tab. 2: Classification of surface types and construction parameters for the application of the UBIKLIM bio-climate model

To enable application of the one-dimensional urban climate model MUKLIMO_1 (see ‘Methodology’ section), the extension of each individual land use segment must be considerably greater than a 25 m x 25 m pixel. This means that small streets are not resolved, but are assigned to the surrounding use categories.

Evaluation of the Climatological Time Series Data

Time series climate data from various weather stations have also been recorded for Berlin, some of which provide data over extended periods. Evaluations of characteristic parameters of the air temperature at various locations in the city subject to different urban effects show the effect on thermal load on average over a year, or during extreme weather situations.

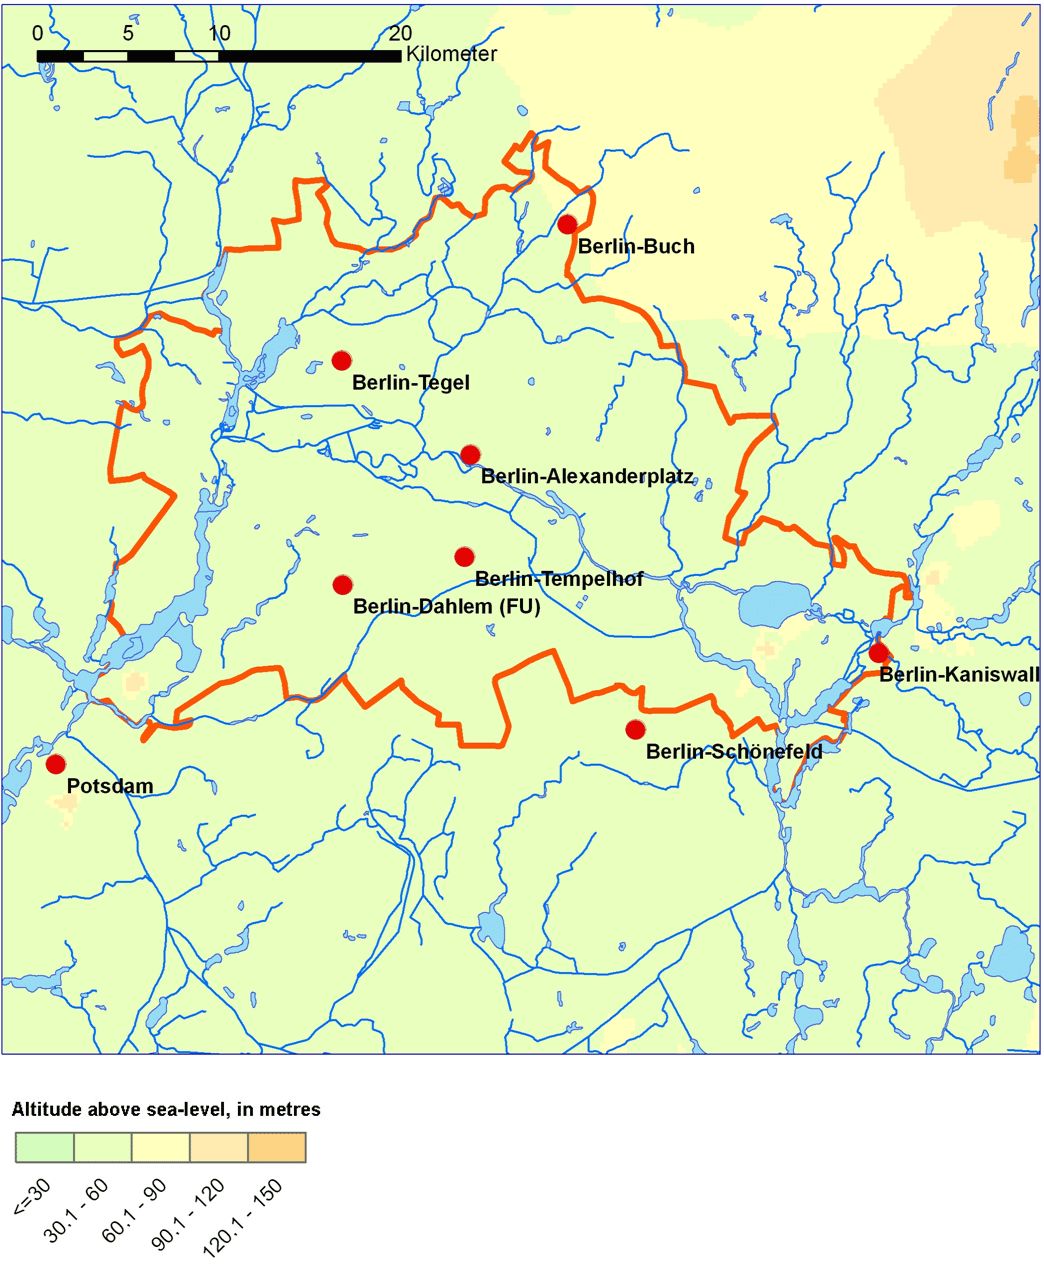
The map (Fig. 3) shows the position of the two climate stations Berlin-Tegel and Berlin-Tempelhof. Both airport sites are situated in relatively open urban areas in the midst of Berlin, with few buildings. By contrast, the surrounding area of the climate station at Berlin-Alexanderplatz, is characterized by dense construction, as an inner-city area with a high degree of soil sealing. The other stations display the features of an urban peripheral location.

Fig. 3: Location of the climate stations used for the mo

Fig. 3: Location of the climate stations used for the modelling process in the city area and immediate surrounding countryside

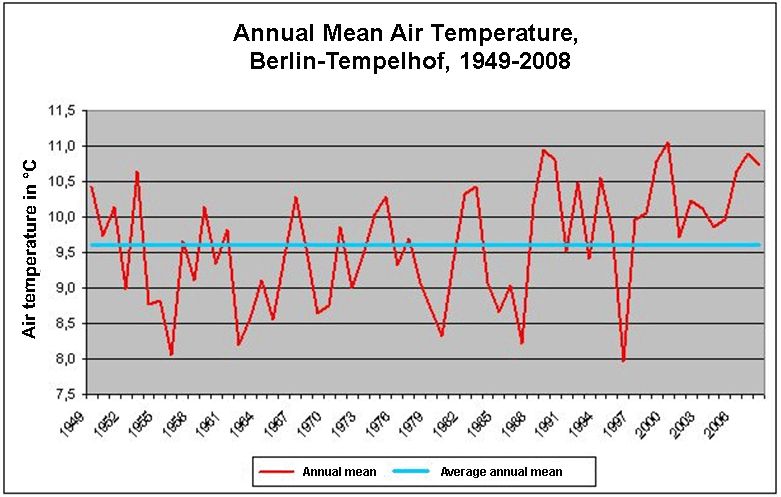
Fig. 4 shows the development of the air temperature at the Tempelhof station between 1949 and 2008. The positive trend, particularly of the last 20 years, is clearly recognizable. After one cold year in 1996, all average annual air temperatures were above the long-term annual mean value of 9.6°C. The warmest year of the entire observation series was 2000, with 11.1°C. The increasing warming affects the entire conurbation; nonetheless, the thermal results in particular Berlin neighbourhoods differ widely.

Fig. 4: Annual mean air temperatures at the Berlin Tempelhof station (1949-2008)

Fig. 4: Annual mean air temperatures at the Berlin Tempelhof station (1949-2008)

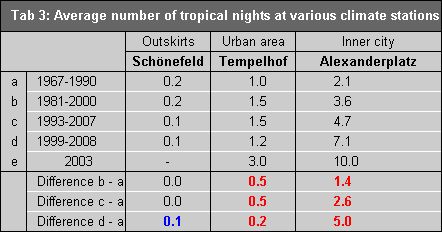
Tropical nights are rare in Germany. Table 3 shows the number of tropical nights (temperature minimum >/= 20°C), and the resulting increase of the “heat island effect”, with its advance into the immediate urban core of Berlin. The different time periods provide information about the increase in thermal load, particularly in the over-heated inner city. There is a mean increase of five tropical nights in the inner city during the 1999 – 2008 period, compared with the 1967 – 1990 period, an increase of 0.2 in the built-up municipal area, and an insignificant drop of 0.1 in the outskirts of Berlin (see Table 3).

Tab. 3: Average number of tropical nights at various climate stations

Tab. 3: Average number of tropical nights at various climate stations

Periods of extreme heat, such as during the summer of 2003, lead to a very great thermal load in densely built-up inner-city areas. At the Alexanderplatz station, ten tropical nights were registered, and there were still three in the built-up municipal area, while no such event occurred at all in the adjacent surrounding countryside.

The Alexanderplatz climate station is characteristic of the situation in an urban heat island. However, since urban structures are not spatially homogeneous, urban heat islands also form in other parts of the city with high development density, high degrees of soil sealing and/or very little green space. On the other hand, in areas with large parks, temperatures that hardly differ from those of the surrounding countryside are recorded.