Impervious Soil Coverage (Sealing of Soil Surface) 2011

Map Description

In the map, the degree of impervious coverage, i.e. the coverage of the earth’s surface with impermeable materials, is represented as a percentage of the reference area (statistical block or block segment). Generally, the degree of impervious coverage declines from the city centre toward the outskirts, since the building structure toward the outskirts is less dense, and the outskirts areas are either completely undeveloped (forest or farmland), or characterized by detached homes. The exceptions to this are the traditional centres of boroughs like Spandau and Köpenick, which were separate cities prior to 1920. There, the impervious coverage degree is about 60 %, and more than 90 % in their core areas. The large new development areas at the outskirts, such as Marzahn, Hellersdorf and Hohenschönhausen, or Gropiusstadt in Neukölln and the “Thermometer Estate” in Lichterfelde, are between 50 % and over 80 % impervious.

The following table shows the average degrees of impervious coverage per section type in 2011.

The highest overall degrees of impervious coverage are shown for the section types “Closed courtyards” with 84.5 %, “Core areas” with 81.9 % and “commercial and industrial areas, large-scale retail, dense construction” with 86 %. The lowest degrees of impervious coverage, with 0 % each, are listed for the section types “Forest” and “Farmland.”

Tab. 5: Mean Degrees of Impervious Coverage per Section Type, 2011

Tab. 5: Mean Degrees of Impervious Coverage per Section Type, 2011

For a better overview, the degrees of impervious coverage are also summarized for each land-use type (ISU categories). Residential areas have an average degree of impervious coverage of 39.5%. The core areas have the highest mean degree of impervious coverage, with 81.9%, while “Forest” and “Farmland” have the lowest.

Tab. 6: Mean Degrees of Impervious Coverage by Land-use Type

Tab. 6: Mean Degrees of Impervious Coverage by Land-use Type

The statistical blocks and block segments of Berlin (without streets and waters) are 27.8 % impervious, on average. Of this, 12.9 % are accounted for by impervious built-up areas, and 14.9 % by impervious non-built-up areas.Including bodies of water and streets, Berlin is thus 32.8 % impervious. Of this, 10.7 % is accounted for by impervious built-up areas, and 12.4 % by impervious non-built-up areas. Impervious streets account for 9.6 % of the Berlin area. Berlin is thus one third impervious. The impervious area in turn consists of roughly equal parts of buildings, streets, and non-built-up impervious areas (one third each).

Impervious Coverage in the Boroughs

For the borough-referenced evaluation, the average degree of impervious coverage of the road surfaces was calculated. For this purpose, statistics on the pavement and road surfacing of Berlin’s streets, bicycle paths and sidewalks were evaluated (SenStadt 2006).

Fig. 7: Degree of Impervious Coverage by Borough (in Percentage of Total Area without Bodies of Water)

Fig. 7: Degree of Impervious Coverage by Borough (in Percentage of Total Area without Bodies of Water)

The borough with the lowest degree of impervious coverage is Treptow-Köpenick, with 21.3 %, while Kreuzberg-Friedrichshain and Mitte have the highest degrees, with 68.7 and 62.7 %, respectively. These two boroughs also have the highest shares of built-up areas, as a proportion of their total areas.

Data on Impervious Soil Coverage in 2011 Compared with 1990, 2001 and 2005

Due to different ascertainment methods, a direct comparison between the impervious coverage values of 1990 or 2001 with 2005 or 2011 is possible only to a limited degree. No change in the impervious area over the course of this period of time can be ascertained from these figures.

In 2001, the degree of impervious coverage in Berlin amounted to 34.7 %, incl. streets and bodies of water. These data are to some extent based on evaluations of satellite images and other sources from the ‘80s (only in West Berlin). This mapping material was expanded to include East Berlin in 1990, and partially updated, in 2001 by means of aerial photography and topographical maps of the area. Here, use-specific flat values were assumed in some cases. Overall, the ascertainment methodology was non-uniform.

The mapping projects of 2005 in 2011 now provide a data set gain from a uniform, completely automated and considerably improved procedure. The result is that the degree of impervious coverage in 2011 amounts to 32.8 %, and is thus approx. 0.9 % higher than the value for 2005. The major share of this increase in impervious coverage is accounted for by the non-built-up impervious areas.

Tab. 7: Results of mapping of impervious coverage in Berlin, 1990 to 2011. (all information refers to the total area of Berlin, incl. streets and bodies of water). Due to changed evaluation methods, no change can be concluded for the entire period of time. The values for 1990 and 2001 are based on different evaluation methods, which do not permit any comparison with the values for 2005 and 2011. However, a comparison between 2005 in 2011 is possible.

Tab. 7: Results of mapping of impervious coverage in Berlin, 1990 to 2011. (all information refers to the total area of Berlin, incl. streets and bodies of water). Due to changed evaluation methods, no change can be concluded for the entire period of time. The values for 1990 and 2001 are based on different evaluation methods, which do not permit any comparison with the values for 2005 and 2011. However, a comparison between 2005 in 2011 is possible.

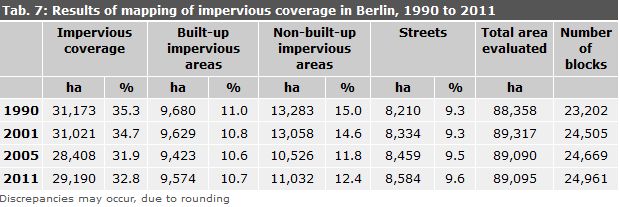
It is notable that the values ascertained for the impervious built-up area over the years are almost identical. This indicates that the old ascertainment methods yielded values that were quite good on the average, since the surveys of 2005 and 2011 using the ALK can be considered very precise.

For the non-built-up impervious areas, the picture is somewhat different. Here, the values ascertained for 2005 decreased by 2.8 percentage points compared with 2001, and increased by 0.9% between 2005 in 2011. The decrease between 2001 and 2005 may on the one hand be due to the fact that on the old maps, some green and open-space categories (e.g. Forest and Farmland) were assigned estimated values for their non-built-up impervious portions, values which we today recognize as having been too high. Since these areas constitute a major share of the municipal area, the degree of impervious coverage was overestimated for the non-built-up impervious areas overall. On the other hand, due to the problems mentioned above regarding the interpretation of the satellite data, the non-built-up impervious areas were more likely to be underestimated under the new method. These assumptions are rather more plausible than the supposition that any reduction in impervious areas actually took place in the municipal area.

With regard to the ascertainment of impervious roadways, the roughly estimated values available in 1990 could not be replaced by values from the Road-Building Authority until 1997. These were used for the evaluations in 2001. For the impervious coverage mapping projects in in 2005 and 2011, degrees of impervious coverage for streets, recorded by borough based on 2006 data, were obtained for the entire city (Gerstenberg & Goedecke 2011). A slight increase in the degree of impervious coverage attributable to the streets category and caused by road-building measures, primarily in East Berlin, certainly seems plausible.

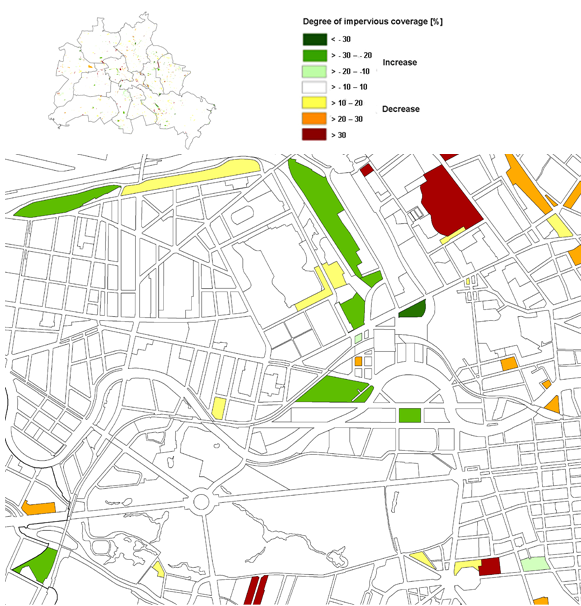
The multiple use of the new procedure in 2011 also permits a comparison with the impervious coverage at block level. Figure 8 maps the changes between 2005 in 2011. Blocks with changes of greater than 10 % of the degree of impervious coverage are shown. However, in the overall accounting of the impervious coverage in the total area and at the level of sector types, smaller changes have also been incorporated.

Investigations during the development of the procedure showed that the ascertainment of the built-up impervious surface was very precise (cf. Validation 2007). For the ascertainment of the non-built-up impervious areas, the precision is not as good. This is due to the following reason:

  • Due to the correction of ISU sector types in 2010, pseudo-changes occurred in 718 blocks.
  • In the SPOT5 satellite image scene of 2005, there were much larger shaded areas than in 2011. These were classified specific to the surroundings. In the comparison, different impervious coverage values could even occur when using the same evaluation methods.
  • For 244 block sectors, the block geometries was changed considerably between 2005 in 2010, causing pseudo-changes to appear in the impervious coverage map.
  • For 37 block sectors, there were no SPOT5 satellite image scenes available in 2005. These sectors were entered into the comparison for 2005 as 0 % impervious. However, since most of them involved forest areas east of Müggel Lake, the error here must be considered minimal.

For these reasons, only blocks with changes in overall impervious coverage of greater than 10 % are shown in the map of impervious coverage changes between 2005 in 2011.

Figure 8: Map of Changes in Impervious Coverage between 2005 in 2011

Figure 8: Map of Changes in Impervious Coverage between 2005 in 2011