Building Heating Supply Areas / Predominant Heating Types 2005

Introduction

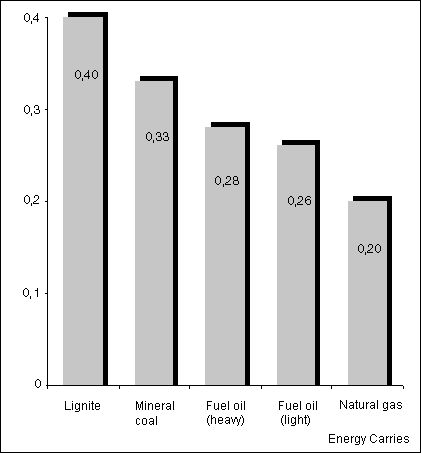
Types of Fuel for Generating Building Heat

On account of the close relationship between the topics covered in Maps 08.01 – “Building Heating Supply Areas” (Edition 2010) and 08.02 – “Predominant Heating Types” (Edition 2010), a common text has been prepared for both maps.

Berlin is the largest contiguous built-up conurbation in Germany. Approximately 3.4 million inhabitants live in an area of 889 km2 (December 2009). The development of heating and heat supply to residential and commercial buildings, as well as the distribution of the various kinds of fuel, are tied to the evolution of the city and are characterized by its social structure and development history.

In the course of the industrialization period after 1875 and the dramatic population increase which this brought with it, Berlin’s old city center (within the present City-Rail Circle Line) developed largely into a city of tenements. On the edge of the inner city, the housing construction companies’ first settlements emerged. In the outer areas, villa colonies and garden city projects were built. Until the end of World War Two, the city’s heating fuel supply relied almost exclusively on lignite and anthracite.

Post-war development was marked by large-scale reconstruction and new building projects, which initially used row construction. From the 1960s to the 1980s, large developments and satellite towns emerged in the outer areas, while the inner city’s housing programs were initially characterized by demolition and construction from scratch. Starting in the mid-1970s, preservation-oriented forms of urban renewal were undertaken, primarily in Wedding and Kreuzberg (cf. Map 06.07, SenStadtUm 2008b). The use of different fuel types for the heating of residential buildings and workplaces developed differently in East and West Berlin during this period.

West Berlin

In the western part of Berlin, coal was increasingly being replaced with other energy sources after the early 1970s. The choice of a substitute fuel type largely depended on local housing structures: in single-family and duplex homes in the outer areas, the primary fuel type used for heating was light fuel oil. For the heating of residential apartment buildings and workplaces, fuel types were chosen largely by proximity to heating supply networks (in the case of energy providers with pipe networks). In-plant oil-fired heating units were also common.

Until 1989, the large number of heating power plants in insular West Berlin facilitated a continuous development of district heating, which was supplied by the Berlin Electric Power Company (BEWAG). As BEWAG was traditionally focused on supplying electricity, however, optimization of its thermal technology structures has proven difficult.

East Berlin

In the eastern part of Berlin, heating relied almost exclusively on lignite and natural gas up to 1989 – in single-family and duplex housing areas and in multi-story old building quarters, but also in workplaces. Approx. 60 percent of the apartments in the eastern part of Berlin were provided with self-contained and/or communal coal heating in 1989; approx. 40 percent of the apartments were provided with district heat from heating plants and heating power plants. Because of usage restrictions in the former GDR, fuel oil was not made available to the heating market.

Berlin After 1989

After 1989, city development in the reunited metropolis experienced several different stages. Between 1991 and 2000, approx. 150,000 new apartments were built. Approx. 60 percent of the newly erected buildings were a part of existing larger compounds. By 1992, construction of existing tower block building projects in the east of the city was completed. In the west, there was little activity in city development. Between 1993 and 1997, numerous major construction projects were undertaken, for example new suburbs in outer areas such as the former farmlands of Karow-Nord, and prestigious inner city projects such as Potsdamer Platz and the new government buildings. Since 1997, the number of new development projects has been declining throughout the conurbation. As a result of the decrease in city development funding, the number of new construction projects in 2003 was almost as low as in 1991. Following a boom of home building in the eastern outer areas and surrounding regions in 1998/1999, this area of development has also begun to stagnate. Nearly 80 percent of the expansive tower block developments in East Berlin, as well as many of the inner city’s old building quarters, have been rehabilitated with the help of state funding (structural renovations, improved residential interiors).

Energy politics, and with them the local heat supply market, changed radically after 1989. Whereas West Berlin’s insular geographical position and East Berlin’s centralized control structures had previously ensured well-defined supply networks, the city’s unification had a destabilizing influence on the supply of energy throughout the city. Berlin was hurriedly linked into the country’s nationwide power and gas networks, and in 1997, Berlin’s main energy supplier BEWAG changed from predominantly public ownership to being fully privatized. The Energy Law amendment of 1998 created new conditions for the domestic power and gas market (cf. Bundesministerium für Wirtschaft und Arbeit 2004). However, market tendencies until the end of 2003 have shown that Berlin’s established energy suppliers BEWAG and GASAG continue to supply the main bulk of power, district heat and gas. In January 2006 the Bewag stock corporation became the Vattenfall Europe Berlin stock corporation.

Also since 1989, the Berlin Senate has widely advanced its energy politics to respond to global climate changes and optimize the use of energy in the local generation of heat. Measures have included:

  • A new bill to encourage economical as well as environmentally and socially viable energy supply and use (cf. Berlin Energiespargesetz – BEnSpG).
  • Energy white paper 1990-1996 to assess the measures of the 1994 Energy Concept (cf. Energiebericht 1990-1996).
  • Collation and agreement of a State Energy Program 2000-2003. This also stipulated as a public service the creation and maintenance of the Environmental Atlas Maps contained herein. On the 18th of July 2006 the State Energy Program 2006-2010 was enacted by the federal state government as an updated version.
  • Numerous other activities and initiatives towards energy usage reductions and energy optimization in the field of building heating (cf. in-depth reports in “Klimaschutz – Schwerpunkte in Berlin” (only in German)).

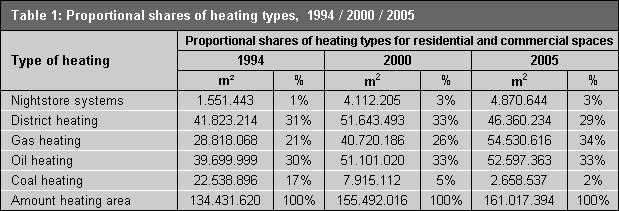
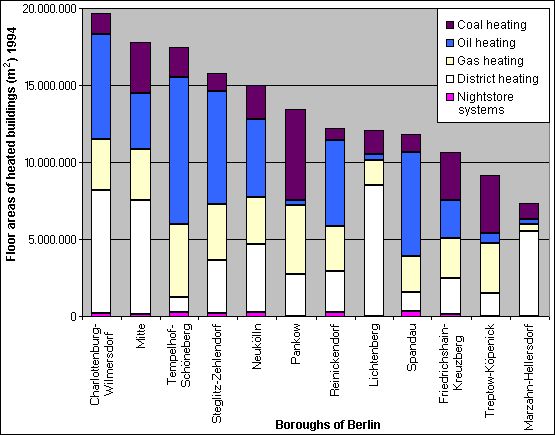
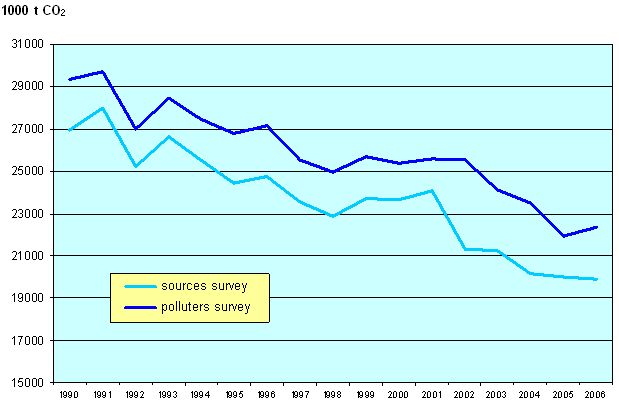
A comparison of our last survey from 1994/95 to the data collected on heating-related energy consumption in 2000 (see table 1) demonstrates vividly the progress that has been made since the introduction of state-funded and private/corporate measures in the field of building heating.

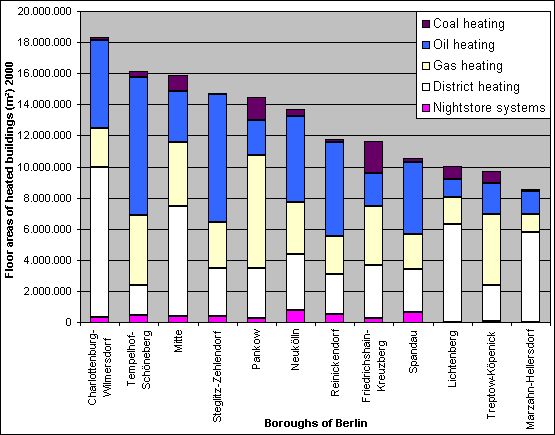
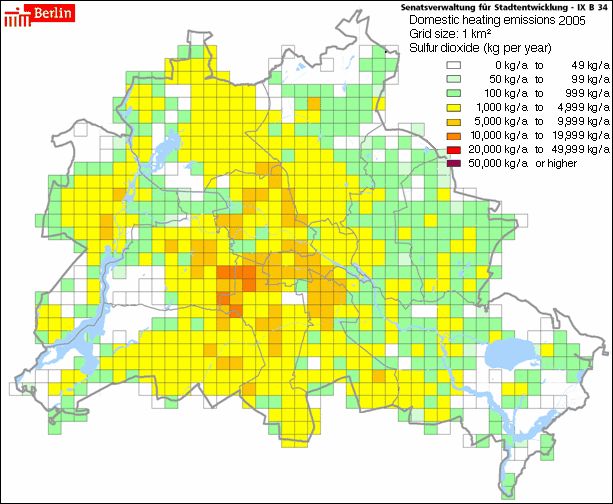
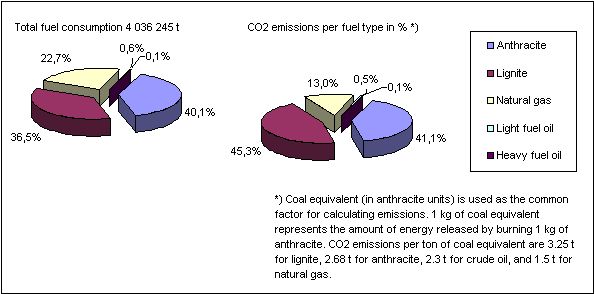
It is visible that especially in the nineties coal was substituted by other heating types, while between 2000 and 2005 the change from district heating to gas heating is noticeable. Emission-reducing measures for domestic heating have proven more effective than for industrial production sites and power plants, as is shown by the lowered emission figures.

Table 1: Proportional shares of heating types in residential and commercial spaces, 1994/2000/2005

Table 1: Proportional shares of heating types in residential and commercial spaces, 1994/2000/2005

As shown in table 1, the total floor area of heated buildings has increased by 17 percent between 1994 and 2005. Residential floor area has increased by approx. 8 percent (1994: 118,255,000 m2, 2005: 131.765.000 m2), and the number of apartments/houses (1994: 1,102,403, 2005: 1.881.837) has increased by 10 percent (Statistisches Landesamt Berlin 1994, 2005). There are currently no figures for the increase in commercial floor area that is heated from non-certified furnace plants; this affects at least 15 percent of the floor areas surveyed.

While the supply of energy, including electricity, still varied greatly between East and West Berlin in 1994, these differences had largely disappeared by 2005. This is mostly due to the substitution of the former coal heated areas in the east districts of Berlin (in the city center as well as in the border area). Especially the gas supplier could win in this process and nearly double their heating areas in the time from 1994 to 2005 while the increases in district heating and local oil-fired heating are significantly lower.

With approx. 4,800 residential and commercial blocks that predominantly rely on gas for heating, natural gas is the most widely used heating source; blocks that predominantly employ oil-fired heating represent the second largest share (approx. 4,300 blocks), whereas district heating ranks third (approx. 1,850 blocks).

All of the heating types that have increased in usage, particularly in the boroughs of former East Berlin, have done so at the expense of coal-fired heating. Between 1994 and 2005, the total floor area heated with coal decreased by approx. 90 percent. Today, less than 2 percent of residential and commercial spaces are heated with coal.

Distribution of the different heating types in the 12 Berlin boroughs and the changes between 1994 and 2005 are illustrated in figure 1, figure 2 and figure 3. Note that in 1994, oil-fired heating had a relatively low share in the outer eastern boroughs (Treptow-Köpenick, Pankow, Lichtenberg, Marzahn-Hellersdorf), whereas coal heating had a comparatively high share. By the beginning of the new decade, this trend was reversed (for further data on the current distribution of heating types see the map descriptions).

Fig. 1: Heating types in residential and commercial spaces by borough, 1994

Fig. 1: Heating types in residential and commercial spaces by borough, 1994

Fig. 2: Heating types in residential and commercial spaces by borough, 1999/2000

Fig. 2: Heating types in residential and commercial spaces by borough, 1999/2000

Fig. 3: Heating types in residential and commercial spaces by borough, 2005

Fig. 3: Heating types in residential and commercial spaces by borough, 2005

With a pipe network of about 1300 kilometers and a heat capacity of 7,683 MW Berlin provides one of the biggest district heating pipe networks in Western Europe. More than 600,000 households, industrial plants and public buildings are provided with heat by this network. Power and head are produced in nine cogeneration plants and more than 200 block heating stations of different size. Biggest supplier is the Vattenfall Europe stock corporation (SenGesUmV 2010c). The pipe network is complemented by the gas supplier GASAG. A gas consumption of 180 million m3 for households, public buildings and industrial plants (without generating stations from Vattenfall) is mentioned in the GASAG company report. Additional about 900 m3 of gas are used in the cogeneration plants of Vattenfall. The part of the gas used by combustion plants requiring official approval for operation is according to the emission declarations about 700 million m3 and their gas consumption is assigned to the GASAG consumer group “business and industry”. So an ammount gas of 1132 million m3 for domestic heating can be assessed.

Fundamental changes in the supply of heating have already resulted in a significant improvement in air quality. Values for all directly emitted pollutants have decreased significantly over the past 15 years. The most drastic reduction is encountered for sulfur dioxide, which in the past was primarily emitted by power plants, industrial plants and coal furnaces. Fig. 4 illustrates the spatial distribution of SO2 emissions.

Fig. 4: Sulfur dioxide emissions resulting from domestic heating in 2005

Fig. 4: Sulfur dioxide emissions resulting from domestic heating in 2005

Whereas in 1994 42 km2 were recorded with SO2 emissions above 20 t/km2/a, only 6 km2 were recorded with SO2 emissions till 10 t/km2/a for 2005 (see figure 4). The highest emission levels caused by domestic heating are still to be found in the densely populated inner city boroughs, particularly between Schöneberg and Wilmersdorf. Other densely populated boroughs such as Gropiusstadt, Märkisches Viertel, Hohenschönhausen and Marzahn, characterized by their tower block parks, do not display excessive emission levels, as these are largely heated with district heat. The emissions generated by district heating can be traced to specific heating power plants, which is shown in Map 08.02.2.

For further in-depth information, please refer to the publication accompanying the current Domestic Heating Database 2000.

Carbon Dioxide Emissions

Carbon dioxide (CO2) has become a widely discussed topic in recent years, but it still cannot be reduced very efficiently through technical measures.

There are a number of cornerstones for implementing the governmental target of a 40 percent reduction in carbon dioxide emissions per capita by 2020 in relation to 1990; these include greater efficiency in the consumption of energy sources for heating and other purposes, as well as sensitive management of all natural resources. In July 2008, the state of Berlin adopted therefor the “Klimapolitisches Arbeitsprogramm Berlin”. Among others, this stipulates a reduction in energy consumption for residential and commercial heating, particularly in public buildings.

Fig. 5: CO2 emissions (kg) per kWh of primary energy released by fuel burning

Fig. 5: CO2 emissions (kg) per kWh of primary energy released by fuel burning

CO2 emission are declining since 1990 in Berlin. In 2006 a reduction of 21,6 percent (sources survey) compared with the year 1990 was achieved, leading to an emission of 19.91 million tons of CO2. Although the total primary energy supply slightly increased in 2006 the switch-over to lower-emission energy sources and conversion process had an positive impact.

 Fig. 6: Total CO2 emissions in Berlin 1990 – 2006; Comparison: sources survey / polluters survey.

Fig. 6: Total CO2 emissions in Berlin 1990 – 2006; Comparison: sources survey / polluters survey.

The Berlin Energy Concept outlines an approach for the state of Berlin to autonomously reduce CO2 emissions by 25 percent between 1990 and 2010. Emissions caused by residential buildings are a focal point; these can only be reduced significantly if the energy consumption in old buildings is thoroughly modernized. Since 1990, the state of Berlin has been exemplary in its funding support for the rehabilitation of old buildings. Between 1991 and 2001, a total of approx. 5 billion euros was allocated to a number of rehabilitation programs:

  • Heating modernization program
  • Tower block rehabilitation program
  • Program for urban gentrification and repopulation of vacant spaces
  • Program for city-wide measures
  • Program for tenancy modernization
  • Program for the assessment and outsourcing of thermal insulation requirements

The energy-related aspects of these programs aimed to improve the energy consumption efficiency of building shells (thermal insulation, window replacement, etc.), to improve the efficiency of heat supply plants, to replace inefficient stand-alone plants, to replace high-carbon energy sources such as coal and fuel oil with district heat (where feasible) or with efficient local heat solutions (employing e.g. natural gas), and to increase the use of renewable energies.

To date, these programs have reached more than a third of Berlin’s residential spaces and half of the city’s tower block parks.

Rehabilitation of tower blocks has resulted in a reduction of heat consumption for residential heating from approx. 200 kWh/m2a to less than 100 kWh/m2a; a similar reduction was achieved for rehabilitated brick buildings.

While there were more than 400,000 coal ovens to be found in Berlin’s apartments in 1990, this number has now been reduced to approx. 40,000. District heating has increased from approx. 450,000 connections to 580,000, and modern gas heating connections to 155,000 house connections with about 670.000 customers in Berlin and a distribution network of about 6.900 km (cf. NBB online publication.)

The exploitation of solar energy has evolved from a minor niche market to an accepted form of energy generation. Currently there are approx. 62,000 m2 of solar paneling spread over 5,900 solar heat collectors and approx. 7.3 MWp (“p” for “peak output at full solar irradiation”) being generated by approx. 2000 photovoltaic systems. Considering that more than 12,3 GWh of electricity were available to Berlin’s consumers in 2005, the power generated by solar systems is still a very small fraction of the total power supply.

CO2 emission are declining since 1990 in Berlin. In 2006 a reduction of 21,6 percent (sources survey) compared with the year 1990 was achieved, leading to an emission of 19.91 million tons of CO2. Although the total primary energy supply slightly increased in 2006 the switch-over to lower-emission energy sources and conversion process had an positive impact.

For further information on the individual programs, please refer to the State Energy Program itself or to the publication “Klimaschutz – Schwerpunkte in Berlin” (only in German).

Vattenfall’s heating power plants are crucial to the supply of heating in the city, as are the increasing number of local furnace plants. Some of these block-based heating power plants have thermal outputs and fuel types that class them as industrial plants requiring certification, and are therefore not included in the assessment of domestic fuel consumption. The number of certified furnace plants as well as the number of industrial plants requiring certification decreased in the last three survey periods.

While in 2000 243 of the 620 certified furnace plants were in operation this proportion changed in 2004 to 398 to 100 and at the current enquiry to 165 to 64. This is because some furnace plants were put out of service and others do not need a certification anymore because of the more environment-friendly fuels (gas or oil instead of coal). Since the environmental friendliness of the district or local heating provided by these plants depends to a large degree on the fuel used for heat generation, Map 08.02.2 shows the fuel consumption of the larger plants (those generating more than 20 MW of thermal output) in the heating market for 2004.

Fig. 7: Total fuel consumption and CO2 emissions in Berlin’s major heating power plants in 2004

Fig. 7: Total fuel consumption and CO2 emissions in Berlin’s major heating power plants in 2004

Maps 08.01 and 08.02 show the current shares of individual energy carriers for residential and commercial heating in the built-up blocks of the city, and provide a valuable aid for the planned extension of district heat and natural gas within the supply areas. For new building areas, connection possibilities for the existing supply networks are shown.