Impervious Soil Coverage (Sealing of Soil Surface) 2016

Map Description

In the map, the degree of impervious coverage, i.e. the coverage of the earth’s surface with impermeable materials, is represented as a percentage of the reference area (block or block segment area). Generally, the degree of impervious coverage declines from the city centre toward the outskirts, since the building structure toward the outskirts is less dense, and the outskirts areas are either completely undeveloped (forest or farmland), or characterized by detached homes. The exceptions to this are the traditional centres of boroughs like Spandau and Köpenick, which were separate cities prior to 1920. There, the impervious coverage degree is about 60 %, and more than 90 % in their core areas. The extensive areas determined by large estates on the city outskirts, such as Marzahn, Hellersdorf and Hohenschönhausen, or Gropiusstadt in Neukölln and the “Thermometer Estate” in Lichterfelde, are between 50 % and over 80 % impervious.

In the following, Table 5 shows the average degrees of impervious coverage per area type in 2016.

The highest overall degrees of impervious coverage are shown for the area types “Dense block development, closed rear courtyard, 5-6 storey” with 85.6 %, “Core area” with 84.4 % and “Commercial and industrial area, large-scale retail, dense development” with 88.3 %. The lowest degrees of impervious coverage, with below 1 % each, are listed for the area types “Forest”, “Agriculture” and “Fallow area”. A sharp increase in impervious coverage can be observed in the area type “Rental-flat buildings of the 1990s and later”. In recent years, many of these blocks have seen a lot of subsequent densification (e.g. the Beuth-Höfe at Spittelmarkt, Havelschanze in Spandau).

Tab. 5: Mean degrees of impervious coverage per area type, 2016

Tab. 5: Mean degrees of impervious coverage per area type, 2016

For a better overview, the degrees of impervious coverage are also summarized for each land-use type (ISU categories) (cf. Table 6). Residential areas have an average degree of impervious coverage of 41.4 %. Core areas have the highest mean degree of impervious coverage, with 84.4 %, while “Forest” and “Farmland” have the lowest.

Tab. 6: Mean degrees of impervious coverage by land-use type, 2016

Tab. 6: Mean degrees of impervious coverage by land-use type, 2016

The block and block segment areas of Berlin (without streets and bodies of water) are 29.0 % impervious, on average. Of this, 14.7 % are accounted for by impervious built-up areas, and 14.3 % by impervious non-built-up areas. Including bodies of water and streets, Berlin is thus 33.9 % impervious. Of this, 12.2 % is accounted for by impervious built-up areas, and 11.9 % by impervious non-built-up areas. Impervious streets account for 9.8 % of the Berlin area. Berlin is thus one third impervious. The total impervious area in turn consists of roughly equal parts of buildings, streets, and non-built-up impervious areas (one third each).

Impervious Coverage in the Boroughs

The borough with the lowest degree of impervious coverage is Treptow-Köpenick, with 22.3 %, while Kreuzberg-Friedrichshain and Mitte have the highest degrees, with 69.7 and 63.5 %, respectively. These two boroughs also have the highest shares of built-up areas, as a proportion of their total areas.

Fig. 7: Degree of impervious coverage by borough (in percentage of total area without bodies of water)

Fig. 7: Degree of impervious coverage by borough (in percentage of total area without bodies of water)

Data on Impervious Soil Coverage in 2016 Compared with 1990, 2001, 2005 and 2011

Due to different ascertainment methods, a direct comparison between the impervious coverage values of 1990 and 2001 on the one hand with 2005 and 2011 or 2016 on the other hand is possible only to a limited degree. No change in the impervious area over the entire period of time can be ascertained from these figures.

In 2001, the degree of impervious coverage in Berlin amounted to 34.7 %, including streets and bodies of water. This data is to some extent based on evaluations of satellite images and other sources from the ‘80s and only applied to West Berlin. This mapping material was expanded to include East Berlin in 1990, and partially updated, in 2001 by means of aerial photography and topographical maps of the area. Here, use-specific flat values were assumed in some cases. Overall, the ascertainment methodology was non-uniform.

The mapping projects of 2005, 2011 and 2016 now provide a data set gain from a uniform, completely automated and considerably improved procedure. The result is that the degree of impervious coverage in 2016 amounts to 33.9 % (30.192 ha), and is thus approx. 1.1 % higher than the value for 2011.

The numbers show a major increase in built-up impervious areas to reach 10,890 ha. However, this is only partly the result of construction activities; the improved building stock data base was the main cause for the newly recorded built-up impervious areas. Areas that had been recorded as non-built-up impervious in 2011, were now mapped as built-up impervious. Furthermore, this explains the decrease in non-built up impervious areas. According to a qualitative GIS-technical estimate of these built-up areas, the changes amount to approx. 600 ha due to the improved data base. Thus, a considerable growth of approx. 700 ha of impervious area was recorded in these five years. Hence, new construction accounts for just over half of the increase in built-up impervious areas.

Tab. 7: Results of mapping of impervious coverage in Berlin, 1990 to 2016 (all information refers to the total area of Berlin, incl. streets and bodies of water). Due to changed evaluation methods, no change can be concluded for the entire period of time. The values for 1990 and 2001 are based on different evaluation methods, which do not permit any comparison with the values for 2005, 2011 and 2016. However, a comparison between 2005, 2011 and 2016 is possible.

Tab. 7: Results of mapping of impervious coverage in Berlin, 1990 to 2016 (all information refers to the total area of Berlin, incl. streets and bodies of water). Due to changed evaluation methods, no change can be concluded for the entire period of time. The values for 1990 and 2001 are based on different evaluation methods, which do not permit any comparison with the values for 2005, 2011 and 2016. However, a comparison between 2005, 2011 and 2016 is possible

Discrepancies may occur, due to rounding

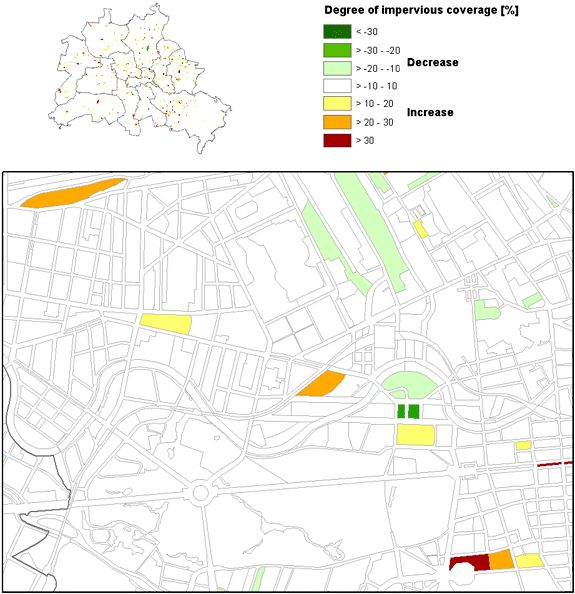
For the non-built-up impervious area, the picture is somewhat different. The apparent decrease by 2.8 % between 2001 and 2005 may on the one hand be due to the fact that on the old maps, some green and open-space categories (e.g. Forest and Agriculture) were assigned estimated values for their non-built-up impervious portions, values which we today recognize as having been set too high. Since these areas constitute a major share of the municipal area, the degree of impervious coverage was overestimated for the non-built-up impervious areas overall. On the other hand, due to the problems mentioned above regarding the interpretation of the satellite data, the non-built-up impervious areas were more likely to be underestimated under the new method. These assumptions are rather more plausible than the supposition that any reduction in impervious areas actually took place in the municipal area. The decrease in the non-built-up impervious area by 0.5 % between 2011 and 2016 is not due to an actual decline in impervious coverage but due to an improved building stock data base. Overall, the proportions of built-up and non-built-up impervious areas have been identified more precisely.

With regard to the ascertainment of the impervious road area, the roughly estimated values available in 1990 could not be replaced by values from the Road-Building Authority until 1997. These were used for the evaluations in 2001. For the impervious coverage mapping projects in in 2005 and 2011, degrees of impervious coverage for streets, recorded by borough based on 2006 data, were obtained for the entire city (Gerstenberg & Goedecke 2011). A slight increase in the degree of impervious coverage attributable to the road category and caused by road-building measures, primarily in East Berlin, certainly seems plausible. Similarly, the degree of impervious coverage of roads, as of 2016, were applied by borough for the 2016 analysis (SenStadtUm 2016b, Goedecke & Gerstenberg 2013 method).

Change Mapping of Impervious Coverage between 2011 and 2016

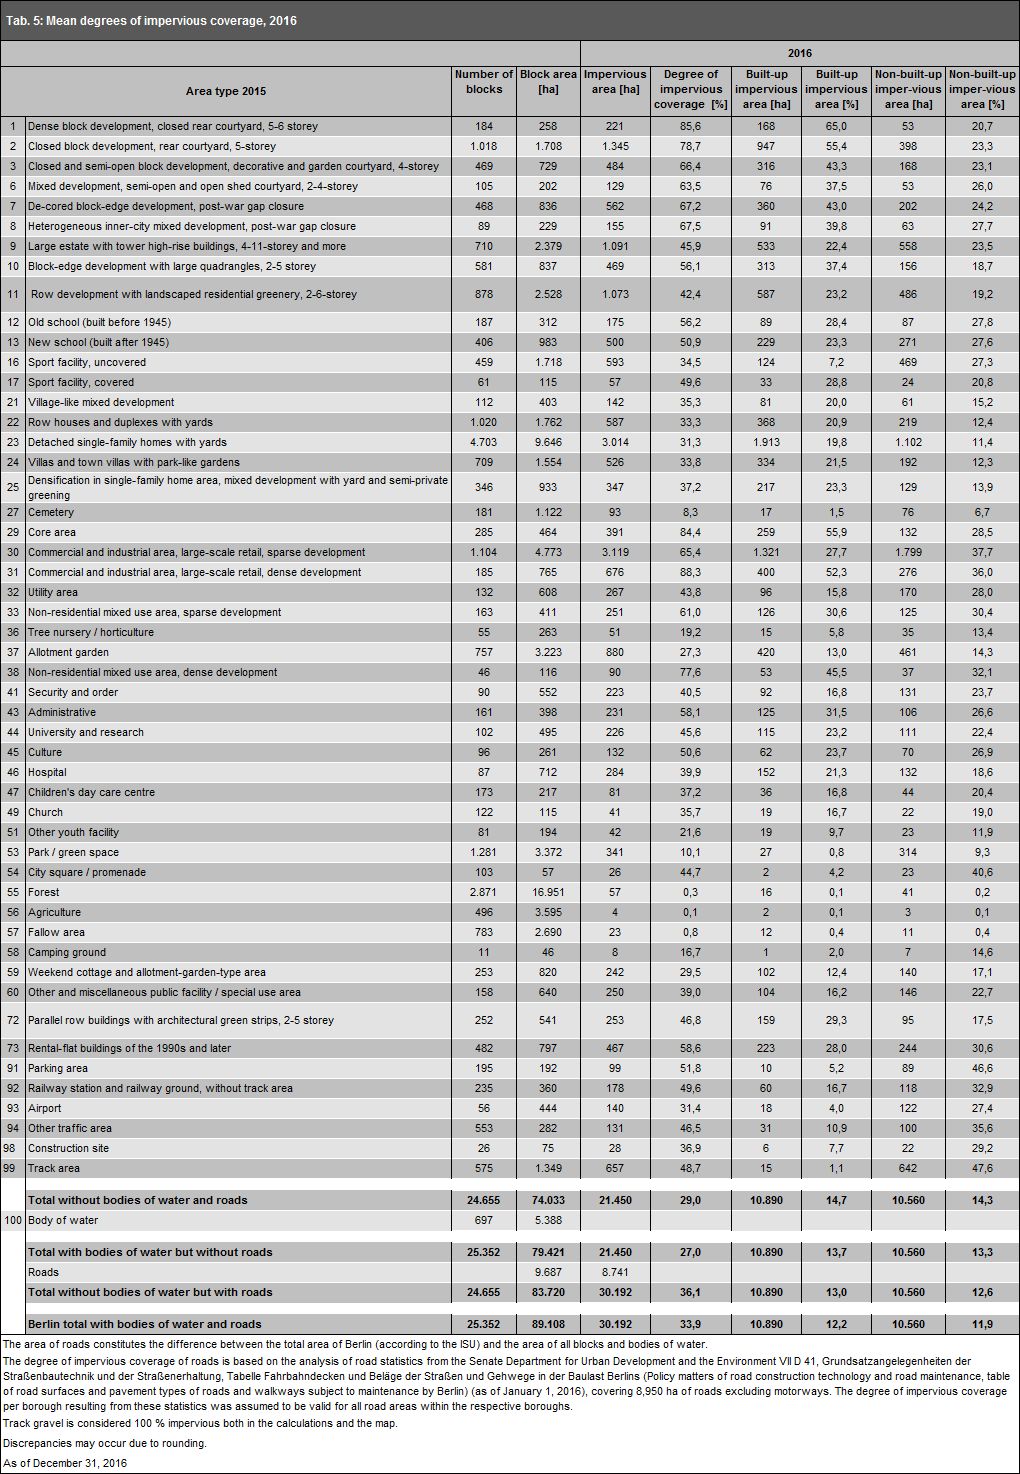
The multiple use of the procedure in 2016 also permits a comparison with the impervious coverage at block and block segment level. Figure 8 maps the changes between 2011 and 2016. Blocks with changes of greater than 10 % of the degree of impervious coverage are shown. However, in the overall accounting of the impervious coverage in the total area and at the level of area types, smaller changes have also been incorporated.

  • For 424 areas, the block geometries changed considerably by more than 10 % of the previous area size between 2010 in 2015, causing pseudo-changes to appear in the impervious coverage map.
  • The improved data base for the building stock and railway tracks led to pseudo-changes rather than actual changes for 718 block and block segment areas. This is the case predominantly for allotment gardens and the area type “Track area”.

In the following, some striking examples are described that serve to highlight the – at times – very case-specific reasons for differences in mapping the degree of impervious coverage for areas between 2011 and 2016.

The decrease in impervious coverage in the commercial area on Blankenburger Straße in Pankow stands out. There has been no actual change here. However, large sandy areas created in 2011 during construction activities are meanwhile overgrown, whereby a decreased impervious coverage was mapped.

Upon analysis of the orthophotos from 2016, the significant decrease in impervious coverage at Schöneweide station can be attributed to the extensive dismantling of tracks and an increased degree of vegetation coverage of the track gravel.

The similarly striking (apparent) decrease in impervious coverage around the Tempelhofer Freiheit is due essentially to the total area being divided into several block segment areas. As a result, the areas overgrown with vegetation are more prominent compared to the mean value of the former total area in the 2010 block map. A change in impervious coverage is effected by areas of formerly impervious runways and storage areas that are gradually becoming overgrown. These changes are detected by the satellite sensor and are thus mapped as partially impervious areas. New residential areas are also clearly visible in the change mapping of the overall impervious coverage. In addition to the rural town of Gatow, the two residential areas at Oskar-Helene-Heim station stand out in particular.

Fig. 8: Map of changes in impervious coverage between 2011 and 2016 (the result is also available as a PDF-Document)

Fig. 8: Map of changes in impervious coverage between 2011 and 2016 (the result is also available as a PDF-Document)